
NEW
Font size
S
M
L
XL
 Worksheets
Handling data
Total questions: 10
Worksheet time: 8mins
Name
Class
Date
1.
How to represent data ?
a)
Arranging numbers
b)
Drawing Graphs
c)
Writing numbers
d)
playing with numbers
2.

How many matches got 3 goals?
a)
2
b)
3
c)
4
d)
5
3.

Kirty bakes cakes to sell at a backery. How many cakes did Kirty bake on Tuesday?
a)
30
b)
32
c)
35
d)
31
4.

How many students' favorite color is blue?
a)
11
b)
12
c)
14
d)
17
5.
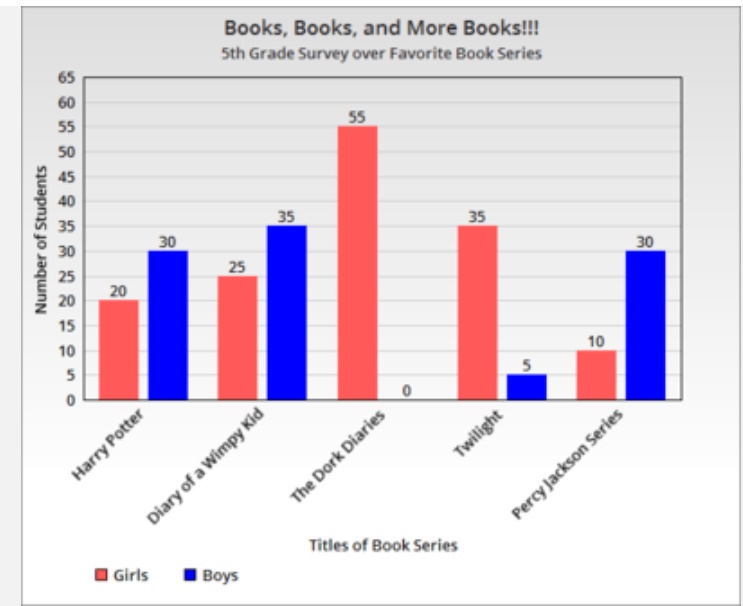
What graph is this ?
a)
Pie chart
b)
Double Bar Graph
c)
Bar graph
d)
Coordinate Grid
6.

Figure 3 shows the marks obtained by five students in a monthly test. Find the difference between the highest mark and the lowest mark obtained.
a)
30
b)
25
c)
20
d)
15
7.
Representation of Data using rectangles of uniform width and equal spacing between them is called____
a)
Tabular form
b)
Bar garph
c)
Pictograph
d)
None of the above
8.
Say 'TRUE' or 'FALSE'
Data obtained in original form is called raw data
Data obtained in original form is called raw data
a)
TRUE
b)
FALSE
9.

What is the sum of TV sets produced on Monday and Friday?
a)
500
b)
450
c)
400
d)
600
10.

The pie chart above shows the favorite fruits of a group of students. Which fruits is the most favorite fruit among students?
a)
Grapes
b)
Pineapple
c)
Banana
d)
Peach
e)
Orange
Reset

