
 Worksheets
Data Wrap Up
Total questions: 24
Worksheet time: 2hrs 0mins

How many data items are on the plot?
16
21
22
100

What is the Maximum data item on this plot?
49
58
1036
35

A florist records the amount of money he spent on gasoline each week to deliver orders. The list shows the data for 16 weeks.
32, 38, 40, 44, 44, 46, 49, 53, 55, 58, 62, 65, 68, 70, 72, 81
He put the data in a stem-and-leaf plot. What number did he leave out of the stem-and-leaf plot?
32
44
65
84

How many students scored more than 80%?
2
13
6
7



What was the population of whales in 2019?
100
10
99
32

The graph shows the number of colored beads used to make a necklace. How many purple and green beads were used in all?
23
20
18
15


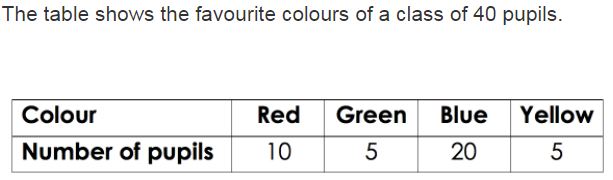
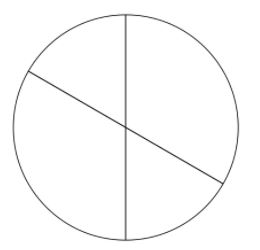
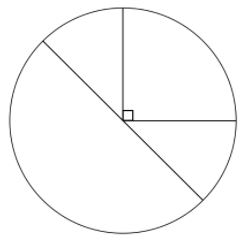
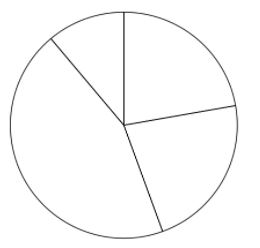
Which pie chart represents the same data as the table?
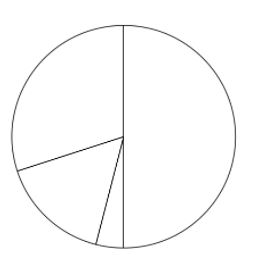


Which table represents the data in the graph?


Which film is the most popular?
Toy Story
Dumbo
Frozen
Cars
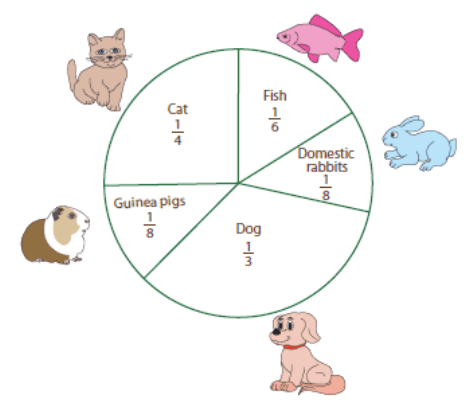
There are 24 animals in Bob's neighborhood. How many cats are in the neighborhood?
3
4
6
8

A class of students were asked their favourite sport. How many more students prefer Rugby to AFL?
12
8
4
6

How many students were surveyed to collect this data?
11
13
15
17

Which of the following is a feature of a histogram?
No gap before the first column
Half column gap before the first column
Full column gap before the first column
Which of the following is a frequency histogram?


Which interval has the greatest number of employees?
11-21
33-43
77-87
44-54
Which of the following is a frequency histogram?


