
 Worksheets
Graphing Skills
Total questions: 16
Worksheet time: 12mins
Name
Class
Date
1.
Which axis usually displays the DV?
a)
X
b)
Y
c)
Z
2.

a)
the independent variable is distance
b)
the independent variable is d=25 t
c)
the dependent variable is time
d)
the dependent variable is distance
3.

a)
The dependent variable is total cost
b)
The dependent variable is weight
c)
The independent variable is total cost
d)
The independent variable is cost of a package
4.

What is the independent variable in the dog data graph?
a)
Dog's Mass (kg)
b)
Year
5.

What does the scale on the left beginning with 0 and ending with 7 represent?
a)
Number of students selling candy
b)
Number of cases of candy sold
c)
Number of candy in each case
d)
Number of days each month that candy was sold
6.

Which axis is the independent variable in an X-Y line graph?
a)
X-axis
b)
Y-axis
7.
Experiment: How does watching TV during studying affect a student’s test grades?
The students grades are the ___________ variable.
The students grades are the ___________ variable.
a)
independent
b)
dependent
8.
Experiment: How does adding cardio to one’s daily schedule affect their heart rate?
The heart rate is the ________________ variable.
The heart rate is the ________________ variable.
a)
independent
b)
dependent
9.
Does the temperature of water affect the time it takes a sugar cube to dissolve? What is the IV (independent variable) in this experiment?
a)
IV: Type of water
DV: Dissolving rate
DV: Dissolving rate
b)
IV: Temperature of water
DV: type of sugar cube
DV: type of sugar cube
c)
IV: Temperature of Water
DV: Dissolving Rate
DV: Dissolving Rate
d)
IV: Time
DV: Number of sugar
DV: Number of sugar
10.
The dependent variable is the one
a)
you measure.
b)
you change.
11.
An experiment is performed on plants to see how different liquids affect plant growth. Each plant in the experiment is given a different liquid; water, apple juice, or milk. Each plant has the same amount of soil, sunlight, and listens to the same music. In this investigation, the independent variable is ...
a)
The type of plant
b)
The amount of sunlight
c)
The type of music
d)
The type of liquid
12.
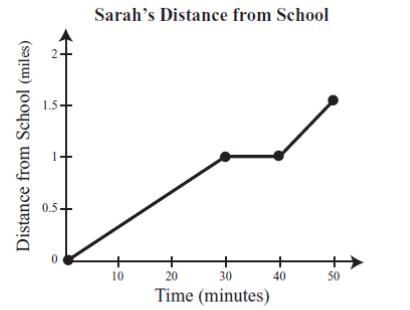
What is happening in the graph between 30 and 40 minutes?
a)
Sarah is accelerating
b)
Sarah is not moving
c)
Sarah is slowing down
d)
Sarah is travelling at a constant speed
13.

What type of graph best shows change of dependent variable over time?
a)
Circle chart
b)
Line graph
c)
Bar graph
d)
Data table
14.

What label is along the y-axis in this graph?
a)
Copyright 2007
b)
Lines
c)
Age in Years
d)
Number of Teens
15.
T8 - What do you need as part of your axis label?
a)
variable and unit
b)
just variable
c)
just unit
d)
neither variable nor unit
16.
The purpose of graphs, charts and tables is to
a)
help scientists visualize results from an experiment.
b)
make the experiment look nice.
c)
practice what I learned in Math class.
d)
Practice my drawing skills.
100 %

