
 Worksheets
Unit 2 Review
Total questions: 54
Worksheet time: 2hrs 26mins

Does this population pyramid represents a More Developed Country (MDC) or a Less Developed Country (LDC)?
MDC
LDC

Is this country Developed or Developing?
Developed
Developing

Predict the future population growth of this country.
Negative Growth (the population will shrink)
Slow/No Growth (the population will stay about the same)
Growth (the population will definitely grow)
Fast Growth (the population will explode)

Predict the future population growth of this country.
Negative Growth (the population will shrink)
Slow/No Growth (the population will stay about the same)
Growth (the population will definitely grow)
Fast Growth (the population will explode)
In an advanced stage of industrialization, a country will exhibit which set of characteristics?
Low birth and death rates, stable population, good living conditions, long life expectancy.
High birth and death rates, stable population, poor living condition, short life expectancy.
High birth rate and low death rate, growing population, good living conditions, long life expectancy.
High birth and death rates, stable population, harsh living conditions, short life expectancy

What is the carrying capacity of the graph?
1000
8000
800
600

What happens if a population grows past its carrying capacity?
The population keeps growing
The population starts to die off
The entire species will go extinct
The carrying capacity just increases

Something that regulates the size of a population is called...
a limiting measure
a limiting factor
carrying capacity
biodiversity
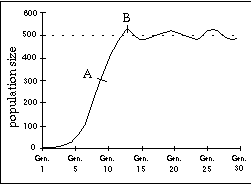
What is the carrying capacity of the graph?
around 500
more than 800
less than 300
around 700
When death rate is equal to birth rate...
population increases
population decreases
population stays the same.
population rapidly increases then becomes stable
When the death rate rises and the birth rate lowers...
population increases
population decreases
population stays the same
all of these

Tracks organisms that tend to live long lives (low death rate and high survivorship rate); toward the end of their life expectancies, however, there is a dramatic increase in the death rate.
Type I
Type II
Type III
Type IV
Describes organisms with a high death rate (or low survivorship rate) immediately following birth. Examples include bacteria, fishes, and invertebrates.
Type I
Type II
Type III
Type IV
These organisms typically live in unstable, unpredictable environments & are able to reproduce rapidly (exponentially). They do not take care of their young & are subject to predation.
k-strategist
r-strategist
m-strategist
s-strategist
These organisms occupy stable environments, are larger in size and have longer life expectancies. They produce, during their life spans, fewer offspring, but place a greater investment in each.
k-strategist
r-strategist
m-strategist
s-strategist
Click density dependent factor(s).
competition for resources
predator-prey relationships
parasitism and disease
weather
Click density independent factor(s).
competition for resources
predator-prey relationships
parasitism and disease
weather, natural disaster and man made disturbances
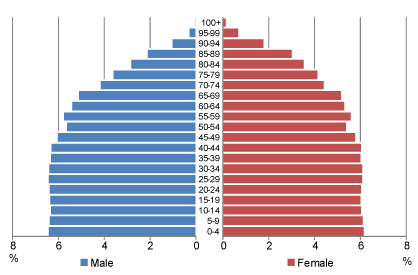

Which of the following leads to a decrease in birthrates among women?
Higher Education
High Infant Mortality Rate
No Prenatal Care
No contraceptives
THESE SPECIES ONLY MAKE A FEW BABIES IN THEIR LIFETIME AND THEY INVEST IN THEM HEAVILY...
K-SELECTED
R-SELECTED
P-SELECTED
Z-SELECTED
The _____ species invest little time and energy on parental care.
k selected
s selected
j selected
r selected
Survivorship curve represented with low death rates during early and middle life, then an increase among older age groups, a good example are humans.
type I
type II
type III
type IV
Survivorship curve represented by a death rate that is constant over organism’s life span, squirrels and songbirds are good examples.
type I
type II
type III
type IV

In Stage 1, the birth rate is...
High
Falling
Low

In Stage 1, the Total Population is...
Growing slowly
Growing quickly
Decreasing

In Stage 2, the Death rate is...
High
Falling Quickly
Low
In Stage 5, scientists believe the Total Population will...
Increase
Stay Steady
Decrease
These animals are not choosy about what they eat or where they live
Endangered
Specialists
Extinct
Generalists
These animals have specific diet and climate requirements
Extinct
Generalists
Specialists
Endangered
These animals might be in trouble if their habitat changes
Generalists
Specialists
Endangered
Extinct


Which of the following pairs of indicators best reflects the availability of health care in a country?
Crude death rate and growth rate
Crude death rate and crude birth rate
Growth rate and life expectancy
Infant mortality rate and life expectancy
Infant mortality rate and crude death rate
Which of the following characteristics are typical of developed countries?
I High technology use
II Low GDP
III Small-scale sustainable agriculture
I only
II only
I and III only
II and III only
I, II and III
Which of the following statements about total fertility rate is correct
TFR is equal to the crude birth rate minus the crude death rate.
TFR is the average number of children each woman must have to replace the current population.
TFR is generally higher in developed countries than in developing countries
TFR is equal to the growth rate of a country
TFR is the average number of children each woman will give birth to during her childbearing years.
Even if a country reduces its birth rate and maintains replacement-level fertility, its population will still continue to grow for several decades because of
lower death rates
increased income.
population momentum
better health care.
increased life expectancy.
Which of the following countries best exemplifies phase 4 of a demographic transition?
Argentina
China
India
Mexico
Japan
At current growth rates, which country will probably be the most populous in the world after 2050?
China
Brazil
India
Indonesia
United States
Using the rule of 70, a population growing at 10% would double in
7 years
10 years
17 years
15 years
not enough information to tell
Populations whose age structure diagrams are narrower at the bottom than at the top have
high death rates
the same proportion of individuals in each age group
a declining population
a high growth rate
all of the above
A particular country has a Total Fertility Rate equal to replacement level fertility and emigration equal to immigration. Which of the following must be true?
The population will begin shrinking within ten years, based on the Rule of 70.
The population must be stable.
The population will begin growing as soon as TFR = 2.1.
Infant mortality must also be less than Crude Death Rate.
There is not enough information to tell.
The total fertility rate for a nation that would keep its population size stable is called
total replacement fertility
total fertility rate
transition fertility
replacement fertility
The average number of children a female member of a population has during her lifetime is the population's
total fertility rate
replacement fertility rate
fertility compensation rate
average fertility rate
The four stages of demographic transition in order are...
pre-industrial stage, transitional stage, industrial stage, and post-industrial stage
pre-industrial stage, industrial stage, transitional stage, and post-industrial stage
transitional, pre-industrial,industrial, post-industrial
pre-industrial, industrial, post-industrial, transitional
During this stage of demographic transition, both death rate and birth rate are high
post-industrial
transitional
industrial
pre-industrial
During this stage the death rate declines and the birthrate is stable so the the population increases
pre-industrial
industrial
transitional
post-industrial
During this stage, the birth rate and the death rate are low.
pre-industrial
transitional
industrial
post-industrial
Better educational opportunities for women are closely tied to
declining fertility rates
success of males in the country
increased death rates
higher fertility rates

