
 Worksheets
Analyzing One Variable Data Review
Total questions: 54
Worksheet time: 2hrs 55mins


If your teacher asked you to make categorical observations about the class’s pet hamster, which group of words might be used?
A mass of 3 kg, 11 cm long, age of 16 months
A mass of 3 kg, 11 cm long, cute
A long hair, white and brown colored, soft
A temperature, length, weight
Which of the following is an example of quantitative data?
High School Graduate or Not
Monthly paycheck amount
Whether or not you are employed
What type of vehicle you drive

According to the Internet Movie Database, Avatar is tops based on box-office receipts worldwide. The table displays data on several popular movies. Identify the individuals in this data set.
The movie titles
The year
The rating
The Genre
The running time
According to the Internet Movie Database, Avatar is tops based on box-office receipts worldwide. The table displays data on several popular movies. Identify the variables in this data set.
Movie titles, year, ratings, time, and genre
Year, ratings, time, genre, and box office earnings
Movie titles, ratings, and genre
Year, time, and box office earnings.


This pie chart shows the colour of hats that Tom owns. Which colour hat does he own the second most of?
red
blue
green
yellow

This pie chart shows the colour of hats that Tim owns. What fraction of Tim's hats are blue?
41
25
31
impossible to say

These pie charts show how people travel to work in 2 towns. In which town do more people travel to work by bike?
town A
town B
both the same
impossible to say

What is the range for this data set? Remember to subtract the minimum value from the maximum value.
10
15
25
30

What is the median for this data set? Remember to rank the data in order from least to greatest, then find the median, which is the middle number in the ranked set of data.
55
60
70
75

What is the mean (average) for this data set? Remember to add all of the data then divide by the total number of data collected.
60
62
64
66

What is the mode for this data set? Remember the mode is the most common or most frequent data.
150
170
180
190

What is the maximum value for this data set?
90
96
102
108

What is the minimum value for this data set?
78
72
66
60
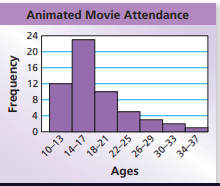
What is the shape of the data?
symmetrical
skewed left
skewed right
bell curve

What is the shape of the data?
symmetrical
skewed left
skewed right
bell curve

What is shape of the data?
symmetrical
skewed left
skewed right
bell curve

What is the shape of the data?
symmetrical
skewed left
skewed right
bimodal

Where is the gap in the data?
between 23 and 25
between 17 and 20
at 18
at 22

Which statement describes the distribution of data in this histogram.
Life is good
Corn Flakes are never symmetrical
There's a round-shaped gap, or hole, in Cheerios.
WAIT A SECOND...THIS IS NOT A HISTOGRAM - IT'S A BAR GRAPH! trick question...


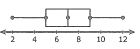
Which car club has the higher median?
Cruisers
Car Hops
Neither. Can't determine median from the graph.

What is the interquartile of this data?
50
90
110
100
What percentage of the data is between 90 and 140?
25 %
50%
75%
100%
What is the median of this data?
40
90
100
140
150
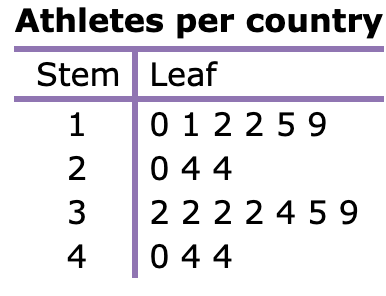
While doing a project for P. E. class, Ling researched the number of athletes competing in an international sporting event.
How many countries have exactly 32 athletes?
4
3
6
1

A Technical Assistance Manager monitored his customers' wait times.
What is the shortest wait time?
30 minutes
48 minutes
31 minutes
71 minutes



Which club has the smaller spread?
Cruisers
Car Hops
When calculating the range of a data set, I need to
subtract minimum - maximum
subtract maximum - minimum
subtract Q1 - Q3
subtract Q3 - Q1
use the 1.5 ( IQR ) rule
What is an advantage of using the range as a measure of variation?
It uses only two entries from the data set.
It uses all entries from the data set.
It is easy to compute.
What is a disadvantage of using the range as a measure of variation?
It is hard to compute.
It uses all entries from the data set.
It uses only two entries from the data set.
Find the sample standard deviation.
2 6 15 9 11 22
49.37
7.03
{ 5, 10, 7, 12, 0, 20, 15, 22, 8, 2 }
$78, $79, $81, $82, $83
Two days later, another store has the same shoes on sale for $65. How does the new price affect the data?
88, 92, 92, 96, 98
Gabriella scored a 20 on her sixth quiz. What effect does this score have?

