
 Worksheets
6.SP. Summative Assessment MYP1: Unit 1 Statistics
Total questions: 85
Worksheet time: 7hrs 5mins

Welcome to Part 1 of your MYP Unit 1: Statistics Summative Evaluation! Please check that you have everything you need to take this amazing assessment!
My I 💜 Math Notebook
Calculator
My Amazing Brain 🧠
Multiplication Chart (if needed)
Ruler & Colors (for graph making)
What is a requirement of a statistical question?
one set answer
a variety of answers
Choose the statistical question:
What is the favorite pet of sixth graders at YMS?
How many sixth graders own a dog?
Statistical questions have _____ possible answers.
zero
one
only two
two or more
What is the main purpose for asking statistical questions?
Surveying people is fun.
We can create charts with statistics.
Statistical questions help us gather data about a topic.

12,10,10,10,13,12,11,13,10
The mode is the number ________________________.
you see most
you see least
you don't see
you see first
What is the mode of this data set?
3, 3, 4, 6, 9 - What is the mode?
3
4
6
9
What is the mode of this data set?
325, 400, 350, 400, 300, 250
400
300
325
250
Find the average of these numbers.
10, 3, 2, 5
5
4
10
3
What is the RANGE of these numbers:
22, 20, 23, 21, 23, 25, 22, 29
5
9
2
6
What is the average of these numbers?
2, 6, 4, 8, 5
8
2
5
7
The range is found by finding the _______________ number and subtracting the ________________ number.
smallest, biggest
even, odd
biggest, smallest
middle, first
3, 5, 7, 4, 3, 1
99, 32, 61, 82, 58, 41, 73, 24, 18
4,5,5,2,3,3,2,8
3, 5, 7, 4, 3, 1
What is another word for AVERAGE?
Mode
Median
Mean
Not nice
Calculate the mean.
2, 9, 10, 6, 8
8
4
7
22
28, 18, 19, 18, 17
Calculate the mean.
10, 4, 5, 9
7
5
8
4
Calculate the mean.
16, 5, 7, 12
9
6
12
10

9
10
8


Which shade of paint was the most popular?
Vanilla Cream
Iceberg
Moonlight
Oatmeal
Ivory

How many more students want to be doctors than singers?
____ more students
4
3
6
5

How many coffee drinks were ordered?
___ coffee drinks
9
10
7
8

There were 3 times as many mystery books checked out as nonfiction books. How many mystery books were checked out?
____ mystery books
15
21
18
24

What is the frequency for time with friends and family?
7
6
8
9

What is the frequency for opening presents?
13
9
7
11

Look at the bar graph, "Nicest Fruit". What does the y-axis show?
Types of fruit
Number of people.

Look at the bar graph, "Nicest Fruit". What scale does the bar graph use?
1
2
5
10

Look at the Bar Graph "Student Grades". Which grade did the smallest number of students get?
A
B
C
D




Look at the Bar Graph, "Student Grades". What grade did the most students get?
A
B
C
D


What does this graph show?
Dogs on a leash
Students
Popcorn sold
Teachers

What day was the MOST popcorn sold?
Monday
Tuesday
Wednesday
Thursday

What day was the LEAST popcorn sold?
Monday
Tuesday
Wednesday
Thursday

How many bags of popcorn were sold on Sunday?
2
3
4
5

What does this graph show?
Number of basketballs
Number of Slam Dunks
Number of teams
Number of people

How many slam dunks did the Celtics score?
1
2
3
4

The histogram above shows the total number of books read by students in the Principal's Reading Club during the school year. How many books were read from January through April.
85
80
95
87

Students at Center Jr. High were surveyed and asked about their favorite school after work snack. The bar graph shows the results of the survey.
Based on the graph, which statement is true?
Twice as many students chose ice cream as chose fruit for their favorite snack.
Twice as many students chose chips/ dips as chose ice cream for their favorite snack.
The same number of students chose chips/ dips as chose cheese & crackers as their favorite snack.
Fifteen more students chose ice cream as chose cheese & crackers as their favorite snack.
Students at Center Jr. High were surveyed and asked about their favorite school after work snack. The bar graph shows the results of the survey.
Based on the graph, which statement is true?
Twice as many students chose ice cream as chose fruit for their favorite snack.
Twice as many students chose chips/ dips as chose ice cream for their favorite snack.
The same number of students chose chips/ dips as chose cheese & crackers as their favorite snack.
Fifteen more students chose ice cream as chose cheese & crackers as their favorite snack.

Kim had a bag with colored marbles in it. The number of marbles in the bag is shown in the bar graph.
Which statement is NOT supported by the information in the graph?
The bag contains more red and white marbles than blue and green.
The ratio of red to blue marbles is 2:1.
The ratio of blue to green marbles is 3:2.
The ratio of red to green is 6.1.

The city council sent letters and emails asking for residents to respond to the type of recycling they did on a regular basis. The bar graph shows the data they received from the residents that responded to the survey.
Which statement is NOT supported by the graph?
Twice as many people recycle plastic as glass.
Three times as many people recycle cans as plastic.
The ratio of people recycling paper as cans is 2:3
The ratio of the number of people who recycle plastic as glass is 2:1.

Based on the graph, what percent of the books checked out was adventure or science fiction?
50%
62.5%
75%
80%










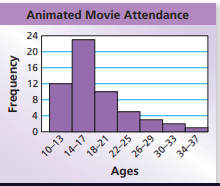
What is the shape of the data?
symmetrical
skewed left
skewed right
bell curve

What is the shape of the data?
symmetrical
skewed left
skewed right
bell curve

What is shape of the data?
symmetrical
skewed left
skewed right
bell curve

What is the shape of the data?
symmetrical
skewed left
skewed right
bell curve
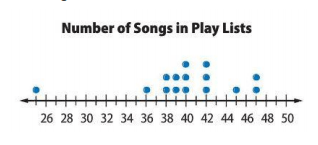
Which statement best describes this graph?
There is a peak at 47.
There is a cluster around 38-40.
The mode is 40.
There is a gap in the data between 39-40.

Which statement best describes this graph?
There is a peak at 2.
There is a gap in the data.
Most people own 1 pet.
There is no mode.

Where is the gap in the data?
between 23 and 25
between 17 and 20
at 18
at 22

Congratulations! Words cannot describe how PROUD I am of the incredible work ethic you showed this past quarter! Go see Mrs. Shereyk for your score and the next part of the assessment!
I am happy with my score!
I would like to reflect and revise my test

