
NEW
Font size
S
M
L
XL
 Worksheets
Graphs of Motion Review
Total questions: 10
Worksheet time: 10mins
Name
Class
Date
1.

What does this graph represent?
a)
Constant speed
b)
Acceleration
c)
Not moving
2.
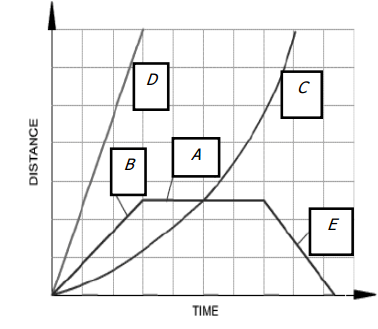
What is happening at E?
a)
Stationary
b)
Accelerating
c)
Fast steady speed; moving away from the starting position
d)
Steady speed; returning to start position
3.

Which runner had a head start?
a)
A
b)
B
c)
C
4.
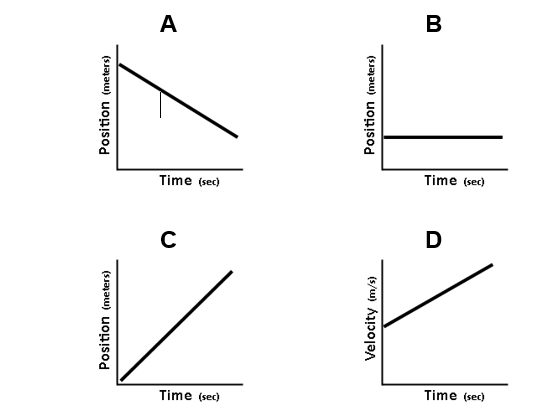
Which graph shows the object with a negative velocity?
a)
A
b)
B
c)
C
d)
D
5.

Which graph is showing the object getting slower?
a)
D
b)
E
c)
both D and E
d)
neither D or E
6.
Which image shows an object speeding up in the negative direction?
a)
b)
c)
d)
7.

The graph shows the velocity of an object vs time. What is happening to the object according to segment B.
a)
The object moves at a constant velocity
b)
The object is speeding up at a constant
c)
The object is slowing down at a constant.
d)
The object is not moving
8.

On this position vs time graph, what is the velocity?
a)
40 m/s
b)
8 m/s
c)
5 m/s
d)
0 m/s
9.

The graph shows the distance a student walks down a hall over time. During which time interval was the student moving the fastest?
a)
A
b)
B
c)
C
d)
D
10.

What is the displacement for the first 3 seconds?
a)
5 m/s
b)
15 meters
c)
25 meters
d)
2.5 m/s
Reset

