
Font size
 Worksheets
data handlling
Total questions: 20
Worksheet time: 19mins
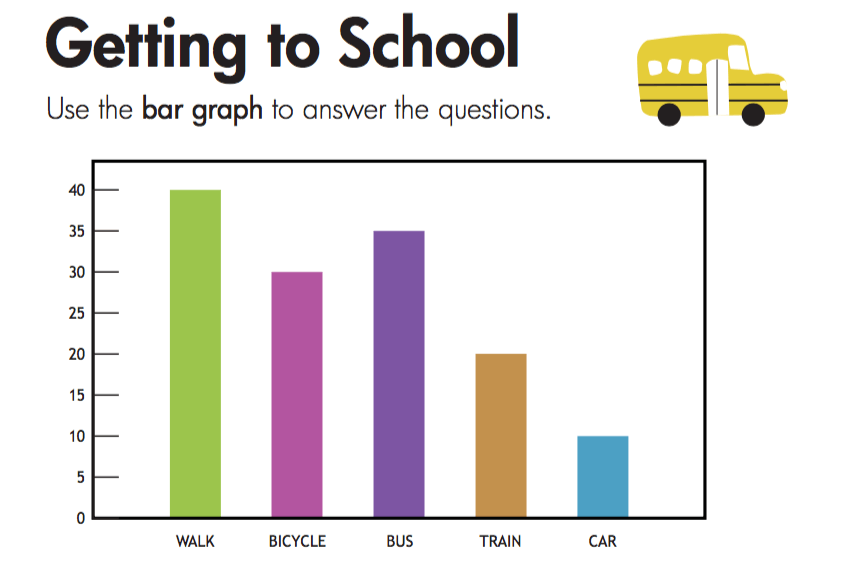

When representing data using a bar chart :
the width of each bar must be uniform
there is no gap between the bars
the bars need to be evenly spaced

How many tally marks?
4
5
6

total number of students in class 1 = _______
38
31
49
40

Which pet got the most votes?
Dog
Cat
Fish

Figure 6 shows the sales of a restaurant for five days. Calculate the total sales for the five days.
1600
1500
1450
1350

Figure 7 shows the height of some tree saplings (anak pokok) of the same type planted two weeks ago. How many tree saplings are there?
5
15
84
86
Aiman wants to create a stem-and-leaf plot of the points his basketball team scored. His team’s points are 99, 87, 60, 85, 55, 55, 87, 79, 76, 49, 40, 91 and 53. Which stem-and-leaf plot correctly shows his team’s points?


Figure 9 shows the number of cookies sold by Puan Farah each week. How many weeks did she sell cookies?
12
13
14
15


What type of data representation as shown in the picture?
Stem-and-leaf plot
Bar chart
Dot plot
Line graph
Tandakan (/) bagi nama carta yang betul
Mark (/) for the right name of the chart below


Students' hobbies
Numerical Data
Categorical data

Which form has the largest number in the school?
FORM 1
FORM 2
FORM 3
FORM 4
State the most suitable method of data collection for the following situations.
(i) The scores obtained by six football teams in a football league
(ii) The favorite sports of a group of students
(i) Survey
(ii) Experiment
(i) Observation
(ii) Experiment
Determine whether the following data is numerical data or categorical data.
(i) The favorite food of a group of students
(ii) The type of vehicles own by the teachers
(i) Numerical data
(ii) Categorical data
(i) Categorical data
(ii) Numerical data

The pie chart above shows the favorite fruits of a group of students. Which fruits is the most favorite fruit among students?
Grapes
Pineapple
Banana
Peach
Orange


How many people have a shoe size of 6?
17
18
19
15.4

