
 Worksheets
data management year 1
Total questions: 19
Worksheet time: 37mins
Name
Class
Date
1.

How many more people chose ladybug than bumblebee?
a)
3
b)
5
c)
4
2.

Katie asked her friends their favorite food. Select the number of tally marks for Hot Dog.
a)
3
b)
4
c)
5
d)
6
3.
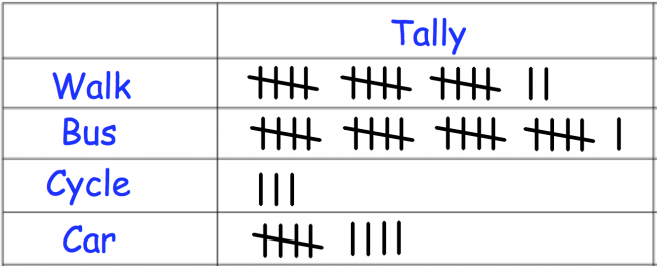
How many people cycle to school?
a)
3
b)
15
c)
4
d)
2
4.

Use the picture to answer the following question.
Which subject did the most children choose?
Which subject did the most children choose?
a)
Math
b)
Reading
c)
Science
5.
How do you group tally marks together?
a)
by ones
b)
by twos
c)
by threes
d)
by fives
6.

Which fruit did most children choose?
a)
apple
b)
banana
c)
grapes
7.

How many people like dogs best?
a)
10
b)
4
c)
6
d)
5
8.
How many people like fish best?
a)
10
b)
4
c)
6
d)
5
9.

Choose the sentence that describes the data in the tally chart.
a)
Pizza had 10 votes.
b)
Pizza got the most votes
10.

How many tally marks?
a)
9
b)
6
c)
3
d)
7
11.
What type of graph is this?
a)
bar graph
b)
pictograph
c)
tally chart
12.
Which pet got the most votes?
a)
cats
b)
dogs
c)
fish
13.

What type of graph is this?
a)
Bar Graph
b)
Pictograph
c)
Line Plot
d)
Tally Chart
14.

How many more people like red than yellow?
a)
3
b)
9
c)
1
d)
4
15.

How many people voted for red as their favorite color?
a)
100
b)
2
c)
4
d)
9
16.

How many children like hamsters?
a)
0
b)
2
c)
4
d)
6
17.

Which pet is the most favorite?
a)
cat
b)
dog
c)
hamster
18.

Which color is the least favorite?
a)
purple
b)
red
c)
green
d)
blue
19.

What is the least favorite flower?
a)
tulip
b)
daisy
c)
rose
d)
lily
100 %

