
Font size
 Worksheets
CBA Review, Algebra 21-22
Total questions: 31
Worksheet time: 36mins

The table shows the amount of pet food in cups remaining in an automatic feeder as a function of the number of meals the feeder has dispensed.
Based on the table, which function models this situation?
f(n)=−3n+24
f(n)=−31n+16
f(n)=−3n+64
f(n)=−31n+8
The graph of f(x)=x was transformed to create the graph of g(x)=f(x)−9 .
Which statement about the graphs is true?
The graph of g is a reflection of the graph of f across the x-axis.
The vertex of the graph of g is 9 units to the right of the vertex of the graph of f.
The graph of g is a reflection of the graph of f across the y-axis.
The y-intercept of the graph of g is 9 units below the y-intercept of the graph of f.
The graph of a linear function k passes through the points (-7, 0) and (1, 8).
Which statement must be true?
The slope of the graph of k is −34 .
The graph of k passes through the point (-1, -8).
The zero of k is 7.
The x-intercept of the graph of k is -7.

The table shows a linear relationship between x and y.
What is the rate of change of y with respect to x?
−29
92
−92
29
What is the solution to −(6m+18)=4(17−m) ?
(a)

What is the domain of the given graph?
1≤x≤4
1<y<4
1<x<4
1≤y≤4
The total distance in centimeters a toy robot moves varies directly with the time in seconds. The toy robot moves a total of 264 cm in 11 secs.
What is the time in seconds the toy robot moves when the total distance is 408 cm?
24s
17s
13s
37s
Which of the following lines goes through the point (-3, 4) and is perpendicular to y = 23x + 6 ?
y = 32x + 3
y = −32x − 2
y = −32x+ 2
y = 23x − 6

Which line has a zero of -5
and a y-intercept
of 3?
F
G
H
J
What is the slope of a
line parallel to the line
y = -9x - 2?
-2
91
−9
21
If the parent function y=x is transformed to have a slope of 32 and a y-intercept of 4, then which is true?
The new line is stretched and translated down.
The new line is compressed and translated up.
Which representation shows y as a function of x?


Which statement about the lines f and g shown in the grid is true ?
Line f and Line g have the same y-intercept
Line f and Line g have the same slope
Line f and line g have the same x-intercepts
Line f and line g are parallel lines

What type of correlation the scatter plot shows?
Positive correlation
Negative correlation
No correlation
Non-linear correlation
What is the slope of the linear equation f(x)=3 ?
3
Zero
3x
Undefined
What is the slope of linear equation x=-4 ?
Undefined
Zero
-4
-1/4
What is the solution to the equation shown?
3x + 2 = x + 8
- 5
3
4
8
It is 72°F at the 5,000-foot level of a mountain, and 38°F at the 11,000-foot level of the mountain.
Write a linear equation to find the temperature T at an elevation x on the mountain, where x is in feet.
T=100.33x−0.0056
T=−176.47x+17705.9
T=17705.9x+176.47
T=−0.0056x+100.33
Which equation has a graph that is parallel to the graph
y=41x+7 and passes through the point (- 12, 2)?
y=−4x−4
y=−4x−46
y=41x+5
y=41x−225

Which equation is best represented by the graph?
y + 2 = 57(x + 7)
y − 2 = 57(x − 7)
y + 2 = 75(x + 7)
y − 2 = 75(x − 7)
Write the equation of a line that passes through the point
(-2, 3) and has a slope of 4.
y = 4x + 11
y = -2x + 3
y = -4x + 1
y = 4x - 2
What is the solution to:
5x - 7x - 14 = 2x + 6?
2
- 5
- 10
- 4
The total distance in centimeters a toy robot moves varies directly with the time in seconds. The toy robot moves a total distance of 264 centimeters in 11 seconds.
What is the time in seconds the toy robot moves when the total distance is 408 centimeters?
24s
17s
13s
37s
Given the function f(x)=4x−5 , what is the value of f(49) ?
14
94
4
−29

Which scatterplot most likely has a line of best fit represented by y=−2x+1 ?


50 min
80 min
45 min
60 min
Which graph represents data that has a correlation coefficient close to -1?
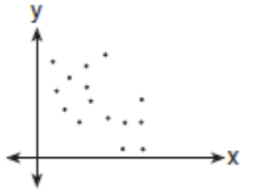
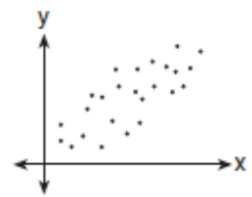
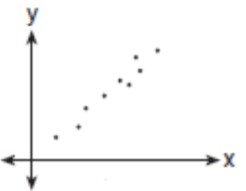
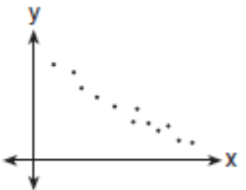
In a science lab, Thelma determined the kinetic energy of an object at various velocities, V, and found the correlation coefficient between kinetic energy and velocity to be 0.872. Which graph shows this relationship?


Using your graphing calculator determine the line of best fit and the correlation coefficient of the data in the table.
y = 4.6x + 347
r =-0 .942
y = 4.6x - 347
r = 0.888
y = 4.6x - 347
r = 0.942
y = 4.6x + 347
r =0 .888

