
 Worksheets
A3 Unit 4 Review: Practice with Statistics
Total questions: 20
Worksheet time: 25mins
The interquartile range is the difference between the upper quartile (Q3) and the lower quartile (Q1).

Which class has a higher range of scores?
Class #1
Class # 2
The ranges are equal
The ranges cannot be determined.

What percent of students in class #1 scored higher than 80%?
25%
50%
75%
100%
What percent of students in class #2 scored less than a 90%?
25%
50%
75%
100%

What is the value of the interquartile range?
115
118
124
9
3
Minimum: 1
Q1: 3
Median: 5
Q3: 7
Maximum: 9
Find the IQR (interquartile range) for the following data.
1, 5, 7, 9, 10, 11, 13, 15, 19
(a)
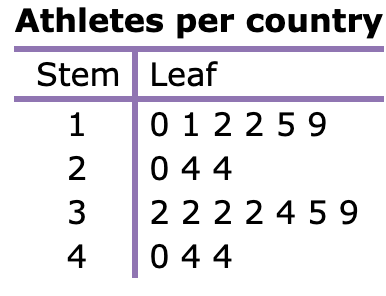
While doing a project for P. E. class, Ling researched the number of athletes competing in an international sporting event.
How many countries have exactly 32 athletes?
4
3
6
1

The employee at the department store counted the number of ties on each tie rack.
How many racks have at least 30 ties but fewer than 40 ties?
4
2
7
5

What is the Mode of this data?
74
56888
68
45

This is the heights (in inches) of the boys and girls in this class. What is the height of tallest girl?
17.9 inches
917 inches
185 inches
179 inches
This is the heights (in inches) of the boys and girls in this class. What is the height of the shortest boy?
145 inches
153 inches
14.5 inches
15.3 inches

This is the home runs for each member of these teams. Which team has the greater max?
Mets
Phillies
Neither
Same

This is the home runs for each member of these teams. Which team has the greater Mode?
Mets
Phillies
Neither
Same
This is the home runs for each member of these teams. What was the maximum number of home runs hit by a Mets player?
15
48
51
100
90.25
88.2
89.2
86.7

The following table shows the number of innings pitched by each of the Downers Grove Rebel's starting pitchers during the Rockland Tournament. If the mean of the data set is 8 innings, how many innings did Brantley pitch?
5 innings
6 innings
7 innings
8 innings

Rachel is a student at the University of Illinois. The following table displays her courses and her grades. Find her GPA (grade point average). This is a weighted mean with A = 5 points, B = 4 points, C = 3 points, D = 2 points, F = 1 point.
3.2
3.4
3.6
3.8

