
 Worksheets
Handling data 2
Total questions: 20
Worksheet time: 14mins

What type of graph is this?
bar graph
pictograph
tally chart

Count the tally marks. What number is shown?
15
3
13
A Carroll diagram uses circles to sort shapes, images and numbers.
true
false

What are the shapes NOT BLUE and NOT TRIANGLES?
Triangles
Squares and Rectangle
Square and Circle

Which is the most favourite pet?
cat
dog
fish

Choose the sentence that describes the data in the tally chart.
Strawberry had 10 votes.
Orange got the most votes
Banana had more votes than pineapple

The block graph shows Year 1S students' favourite sports. How many people like football and basketball?
9
4
10

Which fruit is the least favourite fruit?
apple
banana
grapes

How many GREEN triangles are there?
2
4
3
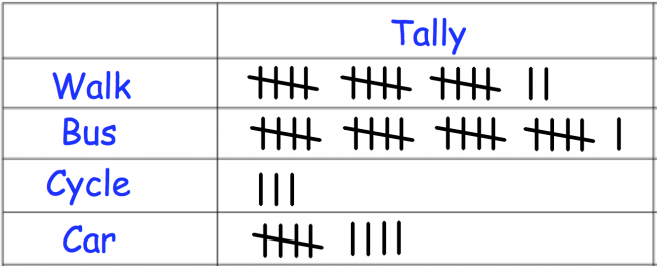
How many students go to school by bus?
21
16
17

Which of the tally marks shows the same number of animals?
Tiger
Giraffe
Elephant
Deer

Name the shapes which are NOT RECTANGLES from the Carroll diagram given.
octagon
hexagon
pentagon
square

How many shapes are with straight lines?
4
3
2

How many fewer people chose grasshopper than bumblebee?
1
2
3
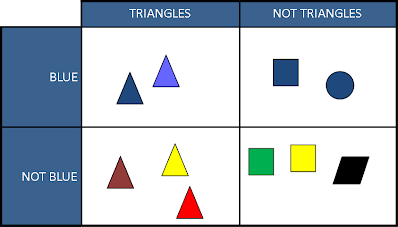
What are the shapes in BLUE but NOT TRIANGLES?
Triangles
Square and Rhombus
Square and Circle

Choose the correct criteria of the triangle.
Shapes with curved lines and blue shape
Shapes with straight lines and pink shape

The bugs were sorted in a Venn diagram based on their colours.
Which of the following is the correct Venn diagram?


How many shapes are red?
3
4
2

How many shapes are NOT GREEN and NOT TRIANGLE?
4
6
7

How many people can dance but cannot swim?
5
4
3

