
 Worksheets
1118-1921 StatisticsTest
Total questions: 78
Worksheet time: 3hrs 50mins

Given the date below, what is the value of N?
30
40
50
60

What is the class interval of the data on the table?
2
3
4
5

Find the mean.
10
20
30
40

What is the value of N?
80
81
85
90
What is the second step in identifying grouped mean?
Find the sum of the resulting column in preceding step.
Multiply the frequency by the midpoint for each class. Place them in another column.
Divide the sum obtained in preceding step by the total number of frequencies.
Find the midpoint for each class (class mark). Place them in a column.

What is the total number of frequency?
25
80
6
79

For this grouped data, what is the mean?
20
25
27
30
Find the mean.
10
20
30
40

For this table of data, what how many values were in the class interval 30-40?
35
140
4
10
The score or value where all the other values in a distribution tend to cluster.
Measure of position
Central Tendency
Mean
Median

What is the modal class of this distribution?
20-29
30-39
40-49
50-59

What is the class size of the grouped data ?
10
4
15
5

The value of X in the table is
32
70
35
38

The data presented in the table have a mean value of:
172
161
157
184

A restaurant sells pizza for the prices in the data table. Calculate the linear regression equation of the data.
y = 1.5x + 12
y = 12x + 1.5
y = 0.67x - 8
y = -8x + 0.67
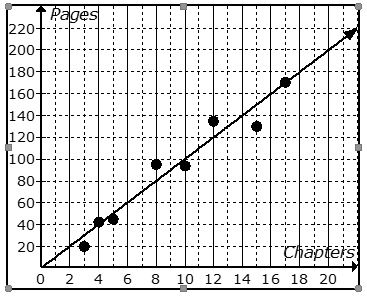
If x is temperature and y is coffee sales, use the following formula to determine the coffee sales on a 34° day.
y = -60x+6443
$4403
$4673
$8483
$6443

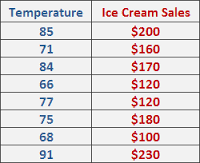
Find the equation of the line of best fit for the given data
y = 163.41x+1.49
y =- 163.41x+ 4.19
y =- 4.19x+163.41
y = 4.19x -163.41
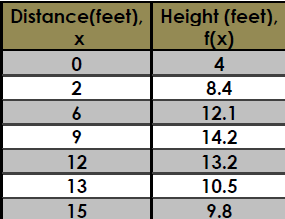
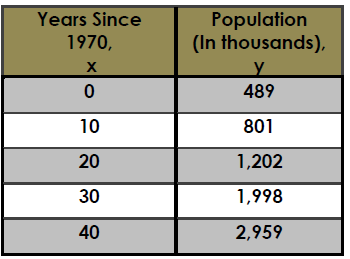


What type of correlation best describes the scatterplot shown.
positive, weak
positive, strong
negative, weak
no correlation

What type of correlation best describes the scatter plot shown?
positive, weak
positive, strong
negative, weak
negative, strong

What correlation coefficient would be describe the correlation?
0
-0.999
0.978
0.2
1,0,1,5,6,3,4

12,10,10,10,13,12,11,13,10
4,2,7,4,3
What is the first step to take when attempting to find IQR?
Find the lower and upper quartile.
Find the median.
Put the list of numbers in order.
Subtract the lower and upper quartile.
Minimum: 1
Q1: 3
Median: 5
Q3: 7
Maximum: 9

5
7
23
16
What is the standard deviation for the data given:
5, 10, 7, 12, 0, 20, 15, 22, 8, 2
6.89
10.1
7.26
9
What is the standard deviation for the data given:
{12, 13, 29, 18, 61, 35, 21}
293.67
15.87
17.14
41.98
6, 12, 16, 11, 8, 4, 1, 11, 4

A survey was taken to find out how many times per year children saw a doctor. The results are shown in the table. What was the mean number of doctor visits per year?
3
3.25
3.5
3.75
Find the mean for the following frequency distribution:
Class limits______________frequency
1 - 6_____________________ 2
7 -12 _____________________8
13- 18 _____________________14
19 - 24 _____________---_____10
22.5
18.4
15.1
13.2


What is a requirement of a statistical question?
one set answer
a collection of answers
What is a requirement of a NON-statistical question?
one set answer
a collection of answers
Is the following question statistical or non statistical?
How many cars are in the NJH parking lot today?
Statistical
Non Statistical
Is the following question statistical or non statistical?
How many siblings does each student in our class have?
Statistical
Non Statistical
Blood type
Categorical
Quantitative
Waiting time in a waiting room
Categorical
Quantitative

The National Survey of Adolescent Health interviewed several thousand teens (grades 7 to 12). One question asked was “What do you think are the chances you will be married in the next ten years?” Above is a two-way table of the responses by gender.
What is the percent of females among the respondents ?
about 46%.
about 54%.
2625
4877



Describe the correlation.
Negative correlation
No correlation
Positive correlation
Constant correlation

If the coefficient of determination is 0.876, what percent of the variation is explained?
56%
88%
-67%
92%
If the coefficient of determination is 0.876, what percent of the variation is unexplained?
56%
88%
12%
92%

