
Font size
 Worksheets
TALLY & PICTOGRAPH 2
Total questions: 25
Worksheet time: 16mins

The tally marks represent __________.
3
4
0

The tally marks represent __________.
6
7
8

The number of __________ is the most.
rectangle
square
triangle

The shapes which has the same number are __________ and __________.
rectangle and triangle
triangle and square
rectangle and square

The least favorite pet is __________.
cat
dog
fish

Tally marks and state the number of oranges.
11
12
13

The most favorite subject is __________.
maths
reading
social studies

The tally marks represent __________.
2
10
12

There are (a) cows .

There are (a) chickens and ducks.

Those are __________.
tally marks
chalk sticks
ice cream sticks
We can represent data through __________.
pictures
symbols
tally marks

That is a __________.
Tally Chart
Bar Graph
Pictograph

There are (a) pupils like pears and bananas.

There are (a) pears.

Julie has the __________ number of candies.
least
most
same
Sam has the __________ number of candies.
least
most
same
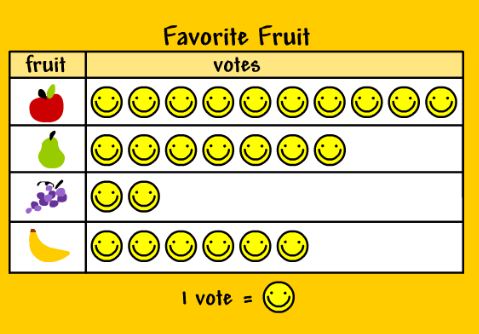
There are (a) pupils like to eat apples.

Only (a) pupils like to eat grapes.

Which sentences describe data in the tally chart?
Pizza had 11 votes.
Pizza got the most votes.
Pizza got the least votes.
How do you group tally marks together?
by ones
by twos
by fives
__________ is a way to show data.
Pictograph
Tally chart
Both

How many people voted for cats and dogs as their favorite animals?
9
8
7
Which animals got the same number of votes?
bear and cat
cat and dog
cat and pig
Which sentences describe data in the tally chart?
Hot Dog got the least votes.
Hot Dog had 5 votes.
Hot Dog had 4 votes.

