
 Worksheets
Analyzing Data (Pie, Bar, Line)
Total questions: 12
Worksheet time: 12mins

What activity did campers enjoy the most?
horseback riding
camp fire
crafts
canoeing
What activity did campers enjoy the least?
horseback riding
camp fire
crafts
canoeing

How many students participated in the survey?
50 students
40 students
30 students
20 students
How many students like mint chocolate chip ice cream?
9 students
6 students
8 students
11 students


Mary is recording her plant's growth in a journal. How many inches has the plant grown from week 1 to 7?
22
18
14
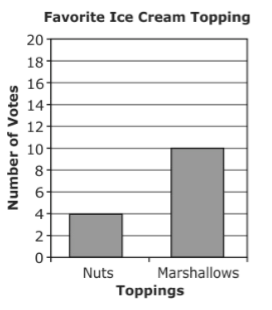
Students voted for their favorite ice cream topping. How many more students chose marshmallows than chose nuts?
4
6
10

Which month did the restaurant sell 40 pizzas?
March
May
July
August

In which month did sales increase the most?
July
June
May
August

How many centimeters of rain fell on the third day?
2
3
4
7

How many use cellphones at the age of 17
341
590
430
530

