
 Worksheets
CHAPTER 5_CORRELATION AND REGRESSION
Total questions: 12
Worksheet time: 12mins
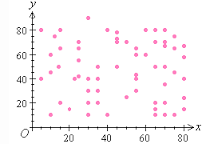
What type of correlation does this graph show?
A) Positive
B) negative
C) none
D) all of the above
As x increases, y decreases.
A) no correlation
B) negative correlation
C) correlation coefficient
D) positive correlation

Estimate the correlation coefficient for this scatterplot.
A) r = 1.2
B) r = 0.89
C)r = 0
D) r = -0.89

Describe the correlation in the graph shown.
A) Strong Negative
B) Strong Positive
C) Weak Negative
D) No Correlation

Estimate the correlation coefficient for this scatterplot.
A) r = -0.9
B) r = 1
C) r = 0.9
D) r = -1
State the independent variable (x) and dependent variable (y) for the case below:
The amount of mileage claims made by salesmen (RM) and the salesman's monthly sales (RM)
x = amount of mileage claims, y = salesman's monthly sales
x = salesman's monthly sales, y = amount of mileage claims
State the independent variable (x) and dependent variable (y) for the case below:
The monthly rents of apartments (RM) and the size of the apartments (square feet)
x = monthly rents of apartments , y = size of the apartments
x = size of the apartments , y = monthly rents of apartments

The value of the coefficient of correlation r lies between:
0 and 1
-1 and 0
-1 and +1
-0.5 and +0.5
Rank correlation coefficient was discovered by
Fisher
Spearman
Karl Pearson
Bowley
Find the rank correlation coefficient between poverty and over crowding of cities from the following data:
Town No of Poor Families PopulationA 17 30
B 13 46
C 15 35
D 16 24
E 6 12
F 11 18
G 14 27
H 9 22
I 7 46
J 12 8
0.73
0.63
-0.73
-0.63

As shown in the table, a person's target heart rate during exercise changes as the person gets older. Find the correlation coefficient (r).
-0.999
-0.664
0.998
1.503

