wayground logo

Free Printable Worksheets

NEW

Font size

S
M
L
XL
Worksheets

Math 7 - 2nd Benchmark Review

Total questions: 20

Worksheet time: 40mins

Name
Class
Date
1.
A die is rolled once.  What is the probability of rolling an odd number? Your answer should be a fraction in simplest form.
a)
1/6
b)
1/2
c)
3/6
d)
2/5
2.
A jar contains 2 pink, 6 red, and 4 blue marbles. If you pick one marble without looking, what is the probability that the marble you pick will be red or blue?
a)
5/6
b)
1/2
c)
1/3
d)
1/6
3.
P(not A) = 
*Remember to simplify.*
a)
6/8
b)
3/4
c)
2/8
d)
1/4
4.
If a dice is rolled 300 times, how many times would you predict a roll of a 1 or a 6?
a)
50
b)
100
c)
150
d)
75
5.

How many outfits are possible with 2 pairs of jeans, 5 t-shirts, and 2 pairs of shoes? (Hint: Use a list, tree diagram or the Fundamental Counting Principle.)

a)

9

b)

40

c)

20

d)

10

6.

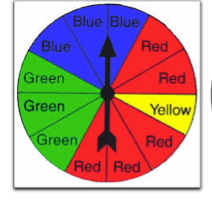
A spinner is spun twice. What is the probability of spinning green both times?

a)

1/16

b)

1/4

c)

1/2

d)

1/8

7.

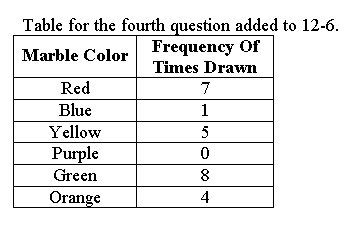
Based on the chart, what is the experimental probability of pulling a green marble?

a)

1/8

b)

8/25

c)

8/100

d)

7/8

8.
Which interval has 400 employees?
a)
33-43
b)
0-10
c)
77-87
d)
66-76
9.
How many students are between 48 and 51 inches tall?
a)
14
b)
8
c)
2
d)
0
10.
Mr. Semo is making a histogram to show the scores on the last science test. He first lists the scores in a stem-and-leaf plot. How many units tall should the bar be for the interval 70-79?
a)
2
b)
5
c)
9
d)
11
11.
21. How many students are represented by the histogram?  
a)
Cannot be determined
b)
9
c)
31
d)
35
12.

The height of the students in Mrs. Abel's class were recorded. Which line plot represents the same data shown in the histogram?

a)
b)
c)
d)
13.
In how many games did the team score more than 20 points?
a)
8
b)
7
c)
10
d)
9
14.

What is the range of the data shown in the stem and leaf plot?

a)

40

b)

56

c)

136

d)

96

15.

The following data shows prices of meal options at Bob’s Burgers.


Prices of Meal Options at Bob’s Burgers

$6 $7 $7 $8 $9 $14 $14 $14 $15 $15 $15 $15 $16 $16 $17


Which histogram correctly displays the information above?

a)
b)
c)
d)
16.

Solve for x

a)

x = 19.6

b)

x = 5/98

c)

x = 101/5

17.

The ratio of a quarterback's completed passes to attempted passes is 7 to 8. If he attempted 24 passes, how many did he complete?

a)

21 passes

b)

8 passes

c)

3 passes

d)

27 passes

18.

6 of the 16 students in Mrs. Crew's class were serving detention. What is the percent of students serving detention?

a)

16%

b)

60%

c)

37.5%

d)

62.5%

19.
Determine where X' would be if you translated X 3 units to the left and 9 units down.
a)
(-4, 4)
b)
(-10, 2)
c)
(-4, -5)
d)
(-1, 5)
20.
∆BCD contains the points: B(2,3) C(2,1) D(5,1). If the triangle is reflected across the x-axis, what will B' be?
a)
B'(2, -3)
b)
B'(-2, 3)
c)
B'(-2, -3)
d)
B'(2, 3)