
 Worksheets
Graphing Natural Selection
Total questions: 10
Worksheet time: 10mins

In this diagram, which insect has the favorable trait, or is well adapted to in its environment?
light insect
dark insect
green insect
purple insect

The graph shows how the population of spiders in one habitat changed over the last 60 years. Based on the data presented in the graph, what can you infer about the population of spiders?
All the tan spiders were eaten by other insects.
The green spiders were best suited for the habitat.
The yellow spiders were best suited for the habitat.
The brown spiders cannot find enough food to eat.

The graph below shows how the finch population in Burke Lake changed during the past 50 years. What is one thing you can infer based on the information presented in the graph?
Thin-beaked finches prey on wide-beaked finches.
Wide-beaked finches are better suited for life in an ocean environment.
Thin-beaked finches are better suited to the environment in Burke Lake.
Wide-beaked finches are better suited to the environment in Burke Lake.

The diagram shows an imaginary situation, in which a population of ladybugs changed over 15 years. What is the probable explanation for this change?
Wings are an advantageous trait.
Black spots are an advantageous trait.
Yellow coloring is an advantageous trait.
Red coloring is an advantageous trait.

The graph shows the change in percentages of grey prey in a population over time. What conclusion can be drawn from the graph?
Grey prey had a high fitness in the desert sand environment
Grey prey had a high fitness in the mountain rock environment
There was an increase in mutations in the population
There was an increase in variation in the population
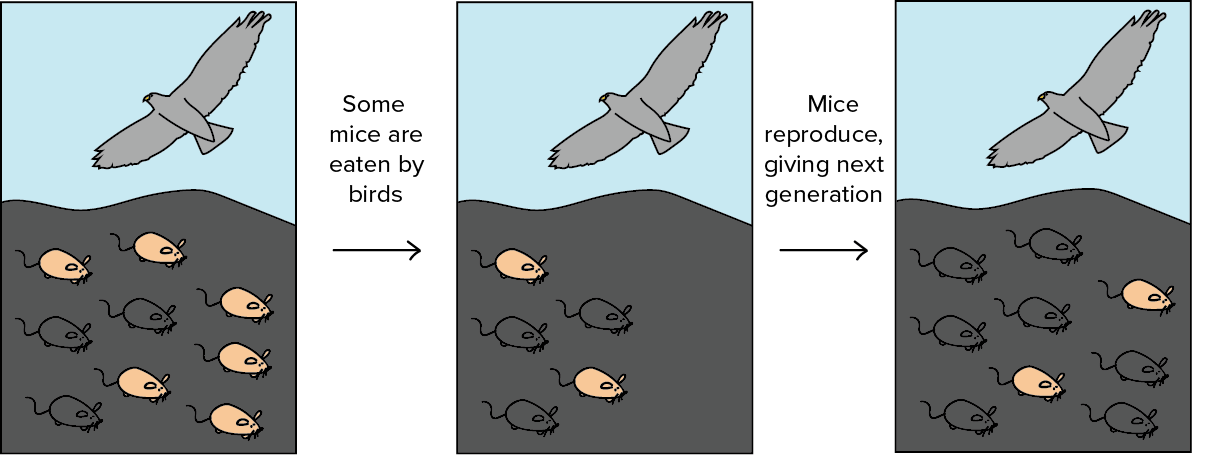
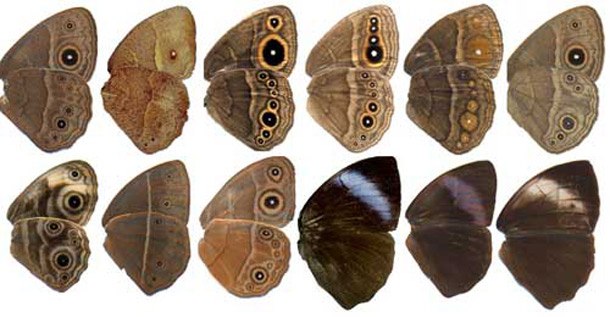

Selective breeding is where _____________ decides which traits should be passed on.
nature
a human
traits
evolution

In recent years "Superbugs" (bacteria that are resistant to antibiotic drugs) are becoming more and more common. How could natural selection explain this?
Superbugs survive antibiotics and reproduce.
Antibiotics cause bacteria to become superbugs
We have always had the same amount of superbugs; modern media just discusses them more.
There is no reliable data on the origin of superbugs.

According to the graph, which allele has the best fitness for the environment?
Allele G (red) has the best fitness for the environment.
Allele g (blue) has the best fitness for the environment.
It is not possible to tell which has the best fitness.
They both have good fitness for the environment.

