
 Worksheets
Economics - Law of Supply
Total questions: 50
Worksheet time: 3hrs 30mins
When producers offer fewer products for sale at the same prices
Supply curve shifts right
Supply curve shifts left
They expect subsidies
The price per unit has decrease
May business are online to help reduce
fixed costs are lower
operating costs never increase
variable costs eliminated
the amount of product producers are willing to bring to the market at any price.
quantity supplied
total product
theory of production
law of supply
Suppliers will normally offer more for sale at high prices and less for sale at lower prices
Quantity supplied
Law of Supply
total production
short run
quantities offered at various prices by all firms that offer products for sale in a given market
total product
total cost
supply
market supply curve
The willingness and ability of a producer to make a product is referred to as
quantity supplied
quantity demanded
supply
demand
Movement along a supply curve demonstrates
a change in quantity supplied
a change in quantity demanded
a change in supply
a change in demand
Which of these demonstrates an example of a supply curve? (More than one answer)


Which of the following supply curves demonstrates a decrease in the quantity supplied?


A decrease in supply is demonstrated by which of the following?


A hurricane wipes out an orange crop in Florida, sharply affecting the supply of oranges. Which chart demonstrates this concept?


The prices for houses steadily increase, causing more people to want to sell their homes. Which of these demonstrates this concept?


Which of the following is NOT one of the determinants of supply?
Change in cost of production/resources
Change in number of sellers
Substitutes
Change in technology
Identify the correct determinant of supply:
Example: If the cost of electricity used to power an automotive factories falls, the supply of cars in the market increases
Cost of production/resources
Number of sellers
Change in expectations
Change in technology
Identify the correct determinant of supply.
Example: If the government requires factories to reduce pollution, complying will initially increase costs of production in the market and reduce supply.
Government regulation
Cost of resources
Worker productivity/motivation
Change in technology
Example: As the demand for DVDs decreased due to consumer preference for streaming movies, the market price for DVDs fell. This lower market price caused sellers to leave the DVD market and supply decreased.
Example: If airlines expect prices for airline tickets to fall in September when families are less likely to travel due the school calendar, they will supply more during the summer months when they can charge higher fares.
Which of the following is NOT a determinant of supply?
Change in cost of production
Technology
Change in number of consumers
Government regulations
A Supply Curve is most often shown with this slope on a graph.
Positive
Negative
Horizontal
Vertical
The Law of Supply is controlled by whom?
Buyers
Sellers
Government
Consumers
What is an example of a production cost for Delta Airlines that would shift supply to the right?
Pilots get a pay raise
Fuel costs increase
More fuel efficient planes
Food prices increase
A shift to the right of the supply curve means...
more will be supplied
less will be supplied
the same amount will be supplied
none of these are correct
How many determinants of supply are there that we learned about in our notes?
2
7
3
5
The Law of Supply says that as the price of a good increases then...
more of that good will be produced
less of that good will be produced
more of that good will be demanded
less of that good will be demanded
Which of the following will cause a shift to the left in the supply of apples?
widespread early frost that damages apple trees
a new fertilizer that is used for growing apples
a tax incentive given by the government to apple growers
more farmers deciding to plant apple trees
What is the opposite of a tax?
Penalty
Subsidy
Deferment
Payment
Which of the following situations would cause the Supply Curve to shift to the left?
A subsidy from the government
A change in the price of the product
A decrease in the number of sellers
A decrease in business taxes

The diagram represents a(n)
increase in supply
decrease in supply
change in quantity supplied
none of the above
What happens to a supply curve when supply goes down?
moves left
moves rights

Which graph below shows the SUPPLY CURVE?
A
B
C
D
On the market demand and supply graph, the vertical or Y axis shows
demand.
equilibrium.
prices.
quantity.
On the demand and supply graph, the horizontal or X axis shows
demand.
equilibrium.
prices.
quantity.
Supply becomes more ________ in the long run.
inelastic
unit elastic
elastic
The cost of electricity or water is a ________ cost for a business.
variable
fixed
In general, if the price of a good or service goes up, what happens to the quantity supply for that good or service?
supply goes up
supply goes down
supply stays the same


What is the biggest factor in determining the elasticity of supply?
time
number of substitutes
necessity vs. luxury
advertisements
Identify the correct determinant of supply.
Example: If airlines expect prices for airline tickets to fall in September when families are less likely to travel due the school calendar, they will supply more during the summer months when they can charge higher fares.
Change in income
Change in number of sellers
Expectation of future prices
Change in technology
The price of milk has recently increased. As a result, what will happen to the supply of icecream at Marble Slab Creamery?
Increase
Decrease
Mr. Goldman goes to the ticket booth to buy tickets for a Lakers game. Mr. Goldman is told that the game is sold out and no tickets are available. Which best explains why there are no basketball tickets available?
The arena forgot to print enough tickets.
The supply of tickets was greater than the demand.
The arena charged too much money for each ticket.
The demand for tickets was greater than the supply.

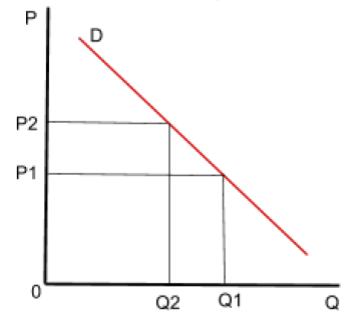
This image represents a(n):
supply schedule
demand schedule
demand curve
supply curve
Why does quantity supplied increase as price rises?
Existing firms produce more AND new firms enter the market
Existing firms produce less AND firms exit the market
The supply curve shifts to the left
Existing firms produce less AND new firms enter the market

