
NEW
Font size
S
M
L
XL
 Worksheets
Graphing Motion
Total questions: 25
Worksheet time: 21mins
Name
Class
Date
1.

What does the slope of each line on the graph tell you?
a)
The speed of each runner
b)
The acceleration of each runner
2.

Which runner complete the 100 meter race in the least amount of time?
a)
Albert
b)
Bob
c)
Charlie
3.

What is happening between 9am and 11am?
a)
The cyclist is traveling up a hill
b)
The cyclists is speeding up
c)
The cyclists is traveling at a constant speed
d)
The cyclist is slowing down
4.

What do you think the cyclist is doing between 11am and 1pm?
a)
The cyclist has stopped for lunch
b)
The cyclists is riding at a constant speed on flat ground
c)
The cyclist is practicing sprints
d)
The cyclist is riding up a hill
5.

What is happening in section C?
a)
going down a hill
b)
speed is increasing
c)
speed is decreasing
6.

What is occurring at E?
a)
It is traveling at a constant speed
b)
there is no change in motion
7.

At which position is the object accelerating the fastest?
a)
c
b)
k
c)
neither because they are slowing down, which isn't acceleration
8.
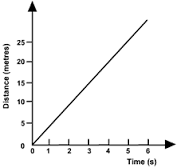
What is the line on this graph showing?
a)
moving away from starting point at a constant speed
b)
moving back towards the starting point at a constant speed
c)
acceleration (getting faster)
d)
deceleration (getting slower)
9.

What does this graph represent?
a)
Constant speed
b)
Acceleration
c)
Not moving
10.
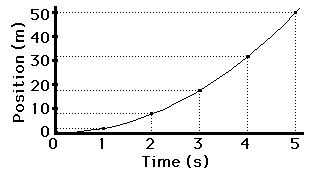
The picture of the position vs. time graph shows an object that is...
a)
accelerating/speeding up
b)
moving at a constant speed
c)
not moving
d)
accelerating/slowing down.
11.

During which interval is the object speeding up?
a)
A to B
b)
B to C
c)
D to E
d)
E to F
12.

During which interval is the object slowing down?
a)
A to B
b)
D to E
c)
E to F
d)
G to H
13.
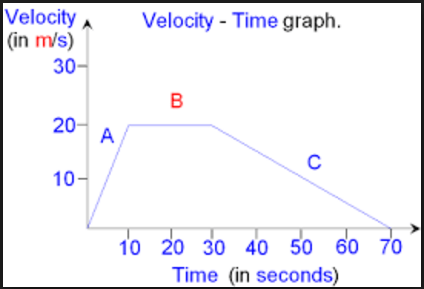
This is a velocity-time graph. What is the object doing in segment A?
a)
Positive acceleration
b)
Negative acceleration
c)
Constant Velocity
d)
Not moving
14.
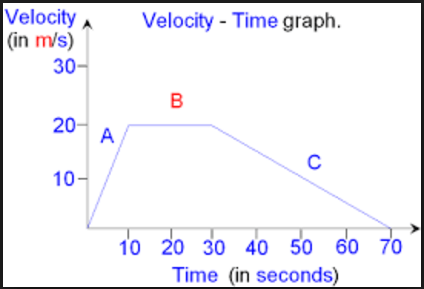
This is a velocity-time graph. What is the object doing in segment C?
a)
Positive acceleration
b)
Negative acceleration
c)
Constant Velocity
d)
Not moving
15.

Calculate the acceleration for segment A.
a)
2 m/s2
b)
20 m/s2
c)
-2 m/s2
d)
0 m/s2
16.
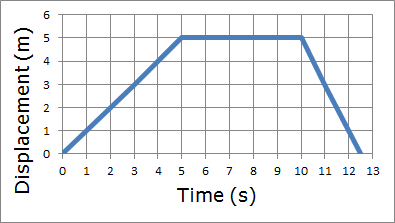
According to the graph how fast does the person travel in the first 5 seconds?
a)
2 m/s
b)
10 m/s
c)
12.5 m/s
d)
1 m/s
17.

The speed of the vehicle between points A-B is...
a)
12m/s
b)
8m/s
c)
10m/s
d)
16m/s
18.
Acceleration: is the rate of change in ___________.
a)
speed
b)
distance
c)
velocity
d)
displacement
19.
The SI unit for acceleration is
a)
mph
b)
m/s
c)
m/s2
20.
Acceleration of an object happens when things ________
a)
slow down
b)
go faster
c)
change direction (turn)
d)
All of the above
21.

What does this graph represent?
a)
Constant speed
b)
Acceleration
c)
Not moving
22.
What is the formula for speed?
a)
distance / time
b)
time / distance
c)
direction / time
d)
direction / distance
23.
How far an object has traveled is what?
a)
time
b)
distance
c)
direction
d)
speed
24.
Velocity is:
a)
speed and direction
b)
distance and direction
c)
time and direction
d)
distance and tome
25.
Time is plotted on the ______________ and distance is plotted on the ___________.
a)
x-axis, y-axis
b)
z-axis, y-axis
c)
y-axis, x-axis
d)
x-axis, z-axis
Reset

