
 Worksheets
Mr. Stein bar graphs 2nd grade
Total questions: 22
Worksheet time: 1hrs 29mins
Name
Class
Date
1.

How many more people like red than purple?
a)
100
b)
10
c)
2
d)
5
2.

How many students take the bus to school?
a)
35
b)
20
c)
10
d)
15
3.

a)
Ginger Snap
b)
Oatmeal Cookie
c)
Sugar Cookie
4.

a)
2
b)
5
c)
3
5.

a)
5
b)
6
c)
4
6.

a)
2
b)
3
c)
1
7.

a)
7
b)
6
c)
5
8.

How many people voted for red as their favorite color?
a)
100
b)
2
c)
4
d)
9
9.

a)
9
b)
10
c)
8
10.

a)
2
b)
3
c)
1
11.

Which fruit did most children choose?
a)
apple
b)
banana
c)
grapes
12.
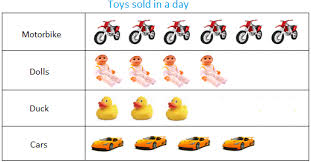
What type of graph is this?
a)
bar graph
b)
pictograph
c)
tally chart
13.

What type of graph is this?
a)
bar graph
b)
pictograph
c)
tally chart
14.
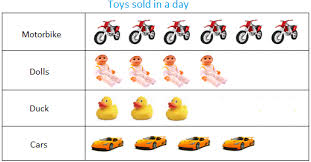
How many more dolls were sold than ducks?
a)
4
b)
3
c)
0
d)
1
15.
How many cars and ducks were sold in all?
a)
7
b)
3
c)
4
d)
8
16.
Which toy was sold the least?
a)
motorbikes
b)
dolls
c)
ducks
d)
cars
17.
Which toy was sold the most?
a)
motorbikes
b)
dolls
c)
ducks
d)
cars
18.
How many people like soccer best?
a)
5
b)
4
c)
8
d)
6
19.
How many people like football and basketball?
a)
9
b)
4
c)
10
d)
2
20.
How many more people like baseball than soccer?
a)
9
b)
3
c)
13
d)
2
21.

What type of graph is this?
a)
bar graph
b)
pictograph
c)
tally chart
22.
Which pet got the most votes?
a)
cats
b)
dogs
c)
fish
100 %

