Wayground logo

Free Printable Worksheets

Font size

S
M
L
XL
Worksheets

Writing

Total questions: 67

Worksheet time: 1hrs 8mins

Name
Class
Date
1.

sentence what should Right

i play but I don t have to

a)

I play, but i don't have to.

b)

I play in the garden after schoolI

c)

I go outside to swing.

2.

How many more children prefer playing cricket than netball?

a)

1

b)

7

c)

6

d)

5

3.

How many more children prefer playing cricket than netball?

a)

1

b)

7

c)

6

d)

5

4.

What sport is the most popular?et

a)

Cricket

b)

Rugby

c)

Football

d)

Cricket and netball

5.

35 children were asked if they prefer cats or dogs. The data is shown in the table. How many girls prefer dogs?

a)

Don't have enough information

b)

2

c)

23

d)

29

6.

The table shows incomplete info about customers' orders in a cafe. How many women visited the cafe in total?

a)

37

b)

15

c)

22

d)

12

7.

The two-way table shows what food and/or drink customers bought from a stall. How many people bought only one item?

a)

10

b)

20

c)

0

d)

30

8.

What is the value of missing number 'b' in the table?

a)

8

b)

not enough info

c)

10

d)

12

9.

How many more children prefer playing football than netball?

a)

1

b)

7

c)

3

d)

4

10.

Which sport is least popular?

a)

netball

b)

rugby

c)

cricket

d)

rugby and netball

11.

40 children were asked if they prefer cats or dogs. The data is in the table. How many girls prefer dogs?

a)

not enough info

b)

32

c)

23

d)

5

12.

The table shows incomplete info about customers' orders in a cafe. How many men visited the cafe in total?

a)

32

b)

15

c)

32

d)

47

13.

The two-way table shows what food and/or drink customers bought from a stall. How many people bought only one item?

a)

9

b)

21

c)

2

d)

12

14.

What is the value of the missing number 'b' in the table?

a)

13

b)

not enough info

c)

11

d)

12

15.

What sport is the most popular?et

a)

Cricket

b)

Rugby

c)

Football

d)

Cricket and netball

16.

35 children were asked if they prefer cats or dogs. The data is shown in the table. How many girls prefer dogs?

a)

Don't have enough information

b)

2

c)

23

d)

29

17.

The table shows incomplete info about customers' orders in a cafe. How many women visited the cafe in total?

a)

37

b)

15

c)

22

d)

12

18.

The two-way table shows what food and/or drink customers bought from a stall. How many people bought only one item?

a)

10

b)

20

c)

0

d)

30

19.

What is the value of missing number 'b' in the table?

a)

8

b)

not enough info

c)

10

d)

12

20.

How many more children prefer playing football than netball?

a)

1

b)

7

c)

3

d)

4

21.

Which sport is least popular?

a)

netball

b)

rugby

c)

cricket

d)

rugby and netball

22.

40 children were asked if they prefer cats or dogs. The data is in the table. How many girls prefer dogs?

a)

not enough info

b)

32

c)

23

d)

5

23.

The table shows incomplete info about customers' orders in a cafe. How many men visited the cafe in total?

a)

32

b)

15

c)

32

d)

47

24.

The two-way table shows what food and/or drink customers bought from a stall. How many people bought only one item?

a)

9

b)

21

c)

2

d)

12

25.

What is the value of the missing number 'b' in the table?

a)

13

b)

not enough info

c)

11

d)

12

26.

What is the value of the missing number 'b' in the table?

a)

13

b)

not enough info

c)

11

d)

12

27.
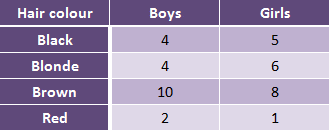
What percentage of the students have brown hair?
a)
25%
b)
60%
c)
45%
d)
50%
28.
What percentage of males drive sports cars?
a)
35%
b)
16.25%
c)
65%
d)
25%
29.
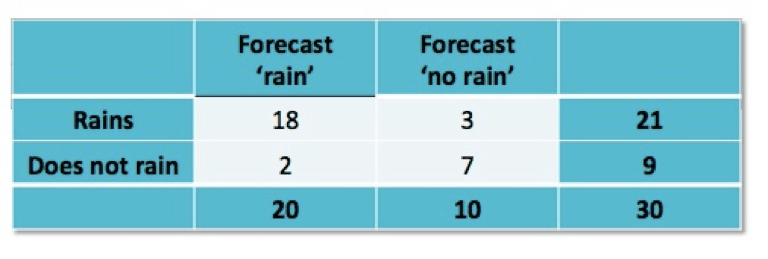
What percentage of the days that it rained, did they forecast no rain?
a)
About 20%
b)
About 18%
c)
About 14%
d)
About 12%
30.
Of the times when the forecast called for rain, what is the percentage that it actually rained?
a)
About 90%
b)
About 50%
c)
About 70%
d)
About 80%
31.
According to the two-way table, a person who plays an instrument is most likely to:
a)
Not play an instrument
b)
Not play a team sport
c)
Play a team sport
d)
All of the above
32.
A survey explored the relationship between gender and band class. Which is a reasonable conclusion?
a)
There are more band members than non-band members
b)
There are more boys in the class than girls
c)
There are more boys in band than not in band
d)
More than half of the bands members in the class are girls
33.
What percentage of the boys had red hair?
a)
5%
b)
10%
c)
12%
d)
4%
34.
What percentage of girls have blonde hair?
a)
30%
b)
32%
c)
29%
d)
40%
35.
What percentage of the students have brown hair?
a)
25%
b)
60%
c)
45%
d)
50%
36.
Which age group liked Action movies the least?
a)
18-25
b)
25-49
c)
50+
d)
238
37.
What percentage of the students were boys?
a)
20%
b)
25%
c)
40%
d)
50%
38.
How many total people were surveyed about what ice cream flavor they would pick?
a)
107
b)
92
c)
70
d)
269
39.
What is the probability you select a person who would pick chocolate?
a)
.398
b)
.342
c)
.26
d)
.686
40.
What is the probability you choose a child that likes Vanilla?
a)
.239
b)
.082
c)
.314
d)
.286
41.
What is the probability you select a teen given that the person likes chocolate?
a)
.112
b)
.267
c)
.164
d)
.056
42.
Given the person is a child, what is the probability they would pick neither?
a)
.26
b)
.195
c)
.286
d)
.214
43.
How many people purchased no food and no drink?
a)
60
b)
10
c)
20
d)
200
44.
What percentage of girls have blonde hair?
a)
30%
b)
32%
c)
29%
d)
40%
45.
What percentage of SUV's are driven by women?
a)
56.25%
b)
75%
c)
83.25%
d)
86.5%
46.
Out of those surveyed, what is the probability that the student is a boy who can't bike to school (in simplest form)?
a)
4/30
b)
7/30
c)
2/15
d)
14/30
47.
What percentage of girls have blonde hair?
a)
30%
b)
32%
c)
29%
d)
40%
48.
What percentage of the students have brown hair?
a)
25%
b)
60%
c)
45%
d)
50%
49.
What percentage of SUV's are driven by women?
a)
56.25%
b)
75%
c)
83.25%
d)
86.5%
50.
What percentage of males drive sports cars?
a)
35%
b)
16.25%
c)
65%
d)
25%
51.
What percentage of the days that it rained, did they forecast no rain?
a)
About 20%
b)
About 18%
c)
About 14%
d)
About 12%
52.
Of the times when the forecast called for rain, what is the percentage that it actually rained?
a)
About 90%
b)
About 50%
c)
About 70%
d)
About 80%
53.
According to the two-way table, a person who plays an instrument is most likely to:
a)
Not play an instrument
b)
Not play a team sport
c)
Play a team sport
d)
All of the above
54.
A survey explored the relationship between gender and band class. Which is a reasonable conclusion?
a)
There are more band members than non-band members
b)
There are more boys in the class than girls
c)
There are more boys in band than not in band
d)
More than half of the bands members in the class are girls
55.
What percentage of the boys had red hair?
a)
5%
b)
10%
c)
12%
d)
4%
56.
What percentage of girls have blonde hair?
a)
30%
b)
32%
c)
29%
d)
40%
57.
What percentage of the students have brown hair?
a)
25%
b)
60%
c)
45%
d)
50%
58.
Which age group liked Action movies the least?
a)
18-25
b)
25-49
c)
50+
d)
238
59.
What percentage of the students were boys?
a)
20%
b)
25%
c)
40%
d)
50%
60.
How many total people were surveyed about what ice cream flavor they would pick?
a)
107
b)
92
c)
70
d)
269
61.
Out of those surveyed, what is the probability that the student is a boy who can't bike to school (in simplest form)?
a)
4/30
b)
7/30
c)
2/15
d)
14/30
62.
What is the probability you select a person who would pick chocolate?
a)
.398
b)
.342
c)
.26
d)
.686
63.
What is the probability you choose a child that likes Vanilla?
a)
.239
b)
.082
c)
.314
d)
.286
64.
What is the probability you select a teen given that the person likes chocolate?
a)
.112
b)
.267
c)
.164
d)
.056
65.
Given the person is a child, what is the probability they would pick neither?
a)
.26
b)
.195
c)
.286
d)
.214
66.
How many people purchased no food and no drink?
a)
60
b)
10
c)
20
d)
200
67.

Draw something and make something for science observationinformation