
 Worksheets
DATA HANDLING
Total questions: 45
Worksheet time: 30mins

There are 600 bananas. How many more Pineapples are there than peaches?
400
200
100
150

How many percentage do the Peach, Banana and Pineapple take up of the pie chart?
60
120
190
216

There are 360 animals total. How many are NOT fish?
40
300
320
280

What activity did campers enjoy the most?
horseback riding
camp fire
crafts
canoeing
Did more campers choose camp fires or crafts as their favorite activity?
camp fires
crafts

How many students participated in the survey?
50 students
40 students
30 students
20 students
How many students didn't like vanilla flavour ice cream?
34 students
36 students
38 students
31 students

Coach Martin surveyed 250 students about their favorite sport and recorded the data in a pie graph.
Which sport was the most popular?
Chess
Badminton
Baseball
Table tennis
25% of a circle is equal to:
one-fifth
a quarter
a half
two fifth


32 people went to a ice hockey match. The pie chart shows the colours of their shirts. How many people wore black?
45
1
4
There are 360 animals total. How many are NOT fish?
40
300
320
280

Do more people enjoy Ham and pineapple or Pepperoni and Pepper?
Pepperoni and Pepper
Ham and Pineapple

The pie chart below shows the percentage of the different types of flowers sold by Mr. John. He sold 120 orchids. How many Carnations did Mr John sell?
150
140
130
120

The same number of pencils are sold on ____________
Monday and Tuesday
Wednesday and Thursday
Thursday and Friday
Monday and Wednesday

How many oranges did I use in my punch?
46
26
36

How many pears and mangoes went in my fruit punch?
46
36
26

How many pies were sold on the most day?
70
140
100

How many more pies were sold on Monday than Wednesday ?
40
30
20

How many more pies were sold on Tuesday than Friday?
50
40
20
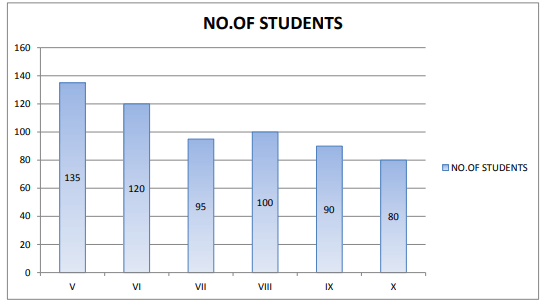
From the given graph, find the number of students in class 7
100
90
95
120


What is the total number of pupils in Primary 2 and Primary 5?
495
505
515
525

Which two levels have an equal number of pupils?
Primary 1 and 2
Primary 2 and 4
Primary 3 and 5
Primary 5 and 6

Kirsty bakes cakes to sell at a cafe. How many cakes did Kirsty on Tuesday?
30
32
35
31

What is the difference of percentage between the most favorite fruits and the least favorite fruits of the students?
20%
10%
7%
3%

If the total number of people surveyed is 400, how many like
walking
400
100
160

This pie chart shows the colour of hats that Tom owns. Which colour hat does he own the second most of?
red
blue
green
yellow

How many people are represented by the pie chart?
11
22
33
44
Pie chart is created using
cherries
apples
data
cars

How many people like birds as pets?
5/8
3/25
7/14
57/23

If we changed the value by x4, how many students voted for Spanish as their favorite subject?
6
18
29
8

How many more votes did apple get than mango?
10
5
20
30

How many people voted for the Central Arena Park as the best?
40
It's none of them!
30
20

How many children voted for Fathima and Suraj altogether?
17
15
20
It's none of them!

How many customers like the Hawaiian Special?
5
7
1
6
How many customers like the Hawaiian Special?
5
7
1
6


The teacher wants to have 40 more pencils than erasers. How many more pencils does the teacher need to buy?
10
20
30
60

The pictograph shows the number of books sold by a leading bookstore in 4 different months.
How many more books were sold in March than in February?
6
8
10
12

