
Font size
 Worksheets
55555
Total questions: 79
Worksheet time: 58mins



How many matches got 3 goals?
2
3
4
5

Rozi collected data about his classmate favourite animal. How many friends who likes parrot as pet?
10
7
12
11

What animal has least likes?
budgie
rabbit
lizard
hamster

How many more cakes on Wednesday and Thursday?
10 cakes
25 cakes
20 cakes
15 cakes

which type of graph is this???
BAR GRAPH
PICTOGRAPH
TALLY MARK
STIMY GRAPH

How many Apples were sold in Thursday and Friday together???
21
22
23
12

How many people loved decorating the tree???
9
5
6
3

What is this chart called?
(a)

What type of graph is this?
(a)

How many tally marks?
4
5
6

Which pet got the most votes?
Dog
Cat
Fish

Look at the given tally marks chart. How many birds did Sara count on Friday?
5
7
6

Look at this pictogram.How many cup cakes sold on Wednesday?
4
24
28

This tally chart shows learners' favourite animals.
How many learners like Tiger and Deer?
25
26
15

This pictograph shows pumpkins picking by six people.
How many pumpkins did Nina pick?
Hint : Look carefully to the given key and then write your answer.
16
15
6

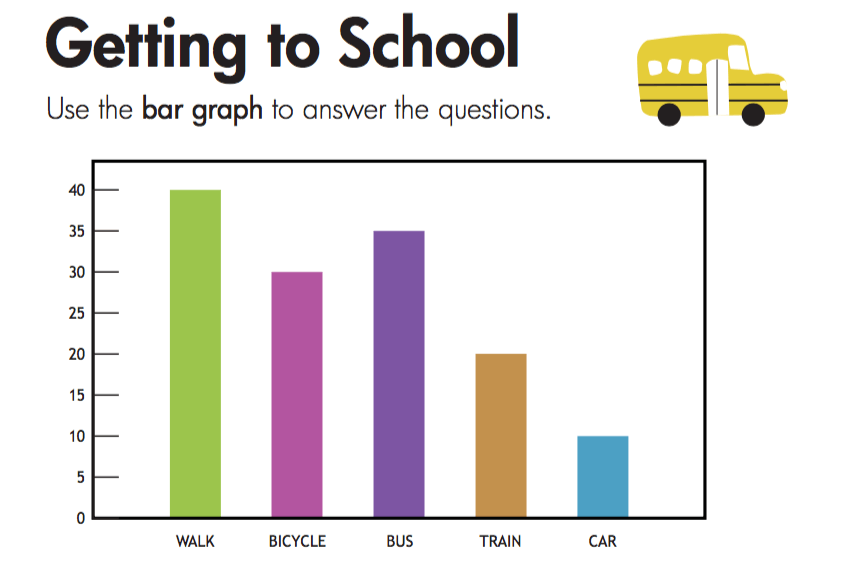
What is the most popular mode of transport to work?
Park and ride
Car
Walk
Cycle


Which subject do students like the least?
math
reading
social studies
Which subject do students like the least?
math
reading
social studies

This pic is showing junk food
false
true

How many children voted for math as their favourite subject?
7
8
6
9

How many cabbages are there?


How many tomatoes are there?


How many bell peppers are there?
How many onions are there?

How many boats are there?


How many Trucks are there?


How many Helicopters are there?

How many sports cars are there?

Which is the most popular vehicle?


Which is the least popular vehicle?

Which of these vehicles has 1?
Which of these vehicles has 7?


Which two animals are same in number?
Lions and ducks
whales and ducks
lion and tortoise

How many tortoises are there in this picture?
3
2
1
5

number of students in class 1_______
38
31
49
40

How many total votes were collected?
5
10
15
20

How many cupcake on Wednesday?
4
24
8
42
Which pet got the most votes?
Dog
Cat
Fish

Which fruit did most children choose?
Apple
Banana
Grapes

Tick one box below that shows all of the animals Dexter saw


Which tally chart shows the right number of each snack?


The pie chart above shows the favorite fruits of a group of students. Which fruits is the most favorite fruit among students?
Grapes
Pineapple
Banana
Peach
Orange

Which fruits is the least favorite fruits of the students? Explain.
Orange is the least favorite fruits of the students because the percentage is the smallest.
Peach is the least favorite fruits of the students because the percentage is the smallest.

Table 1 shows the number of subjects taken by a group of students in SPM examination. Calculate the percentage of students who take at least 9 subjects.
71%
59%
36%
29%

Figure 2 shows five societies participated by students on a co-curricular day. How many students are there on that day?
115
125
130
135

Figure 3 shows the marks obtained by five students in a monthly test. Find the difference between the highest mark and the lowest mark obtained.
30
25
20
15

Table 4 shows Jamil’s monthly expenses. Figure 4 shown is based on the table. What does sector X represent?
Food
Housing Loan
Transport
Insurance

Figure 5 shows the number of patients that visited a private clinic for treatment in one week. What is the total number of patients that visited the clinic within that week?
1600
1950
2000
2150

Figure 6 shows the sales of a restaurant for five days. Calculate the total sales for the five days.
1600
1500
1450
1350

Figure 7 shows the height of some tree saplings (anak pokok) of the same type planted two weeks ago. How many tree saplings are there?
5
15
84
86

Figure 8 shows the number of hours per week spent by 26 students in playing outdoor sports. How many students spend six or more hours a week in playing outdoor sports?
2
3
4
5

Figure 9 shows the number of cookies sold by Puan Farah each week. How many weeks did she sell cookies?
12
13
14
15
Aiman wants to create a stem-and-leaf plot of the points his basketball team scored. His team’s points are 99, 87, 60, 85, 55, 55, 87, 79, 76, 49, 40, 91 and 53. Which stem-and-leaf plot correctly shows his team’s points?


The table shows a part of the results of a survey about the number of children in the families of a group of teachers in a school. The total number of married teachers in the school is 32. What is the number of children which has the highest frequency? (Write your answer in NUMBER only)
(a)

The table shows a part of the results of a survey about the number of children in the families of a group of teachers in a school. The total number of married teachers in the school is 32. State the number of children which has a frequency of 6. (Write your answer in NUMBER only)
(a)

The table shows a part of the results of a survey about the number of children in the families of a group of teachers in a school. The total number of married teachers in the school is 32. What is the number of families that have more than 4 children? (Write your answer in NUMBER only)
(a)

The table shows a part of the results of a survey about the number of children in the families of a group of teachers in a school. The total number of married teachers in the school is 32. Calculate the percentage of families with 2 children. ( Write your answer in NUMBER only. Example 83% )
(a)

The bar chart shows the number of students who wear spectacles and the number of students who do not wear spectacles in four Form 2 classes. State the number of students who wear spectacles in Form 2 Red class. (Write your answer in NUMBER only.)
(a)

The bar chart shows the number of students who wear spectacles and the number of students who do not wear spectacles in four Form 2 classes. Find the total number of students in Form 2 Blue class. (Write your answer in NUMBER only.)
(a)

The bar chart shows the number of students who wear spectacles and the number of students who do not wear spectacles in four Form 2 classes. Find the percentage of students who wear spectacles in Form 2 Green class compared to the total number of students in Form 2 Green class. (Write your answer in NUMBER only. For Example, 24.8%)
(a)

The bar chart shows the number of students who wear spectacles and the number of students who do not wear spectacles in four Form 2 classes. Calculate the total number of students who do not wear spectacles in all the four classes.
(Write your answer in NUMBER only.)
(a)

