wayground logo

Free Printable Worksheets

Font size

S
M
L
XL
Worksheets

Handling Data

Total questions: 34

Worksheet time: 1hrs 14mins

Name
Class
Date
1.
How many total votes were collected?
a)
5
b)
10
c)
15
d)
20
2.
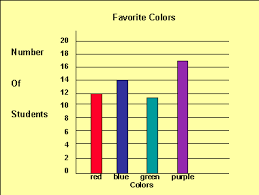
How many more people like red than purple?
a)
100
b)
10
c)
2
d)
5
3.
How many people voted for red as their favorite color?
a)
100
b)
2
c)
4
d)
9
4.
What type of graph is this?
a)
bar graph
b)
pictograph
c)
tally chart
5.
What type of graph is this?
a)
bar graph
b)
pictograph
c)
tally chart
6.
How many people like soccer best?
a)
5
b)
4
c)
8
d)
6
7.
How many people like football and basketball?
a)
9
b)
4
c)
10
d)
2
8.
How many more people like baseball than soccer?
a)
9
b)
3
c)
13
d)
2
9.

The bar graph shows the number of hamburgers sold at Bob’s Burger Shack. On which days were more than 80 hamburgers sold?

a)

Wednesday and Friday

b)

Tuesday and Thursday

c)

Monday, Tuesday, and Thursday

d)

Tuesday, Wednesday, Thursday, and Friday

10.

The graph shows the number of colored beads used to make a necklace. How many purple and green beads were used in all?

a)

23

b)

20

c)

18

d)

15

11.
a)
2 people
b)
8 people
c)
10 people
d)
15 people
12.
a)
2 people
b)
3 people
c)
4 people
d)
7 people
13.
a)
2
b)
3
c)
4
d)
5
14.
What did I forget to put on this bar graph?
a)
The scale
b)
The titles
c)
The pictures
d)
The key
15.
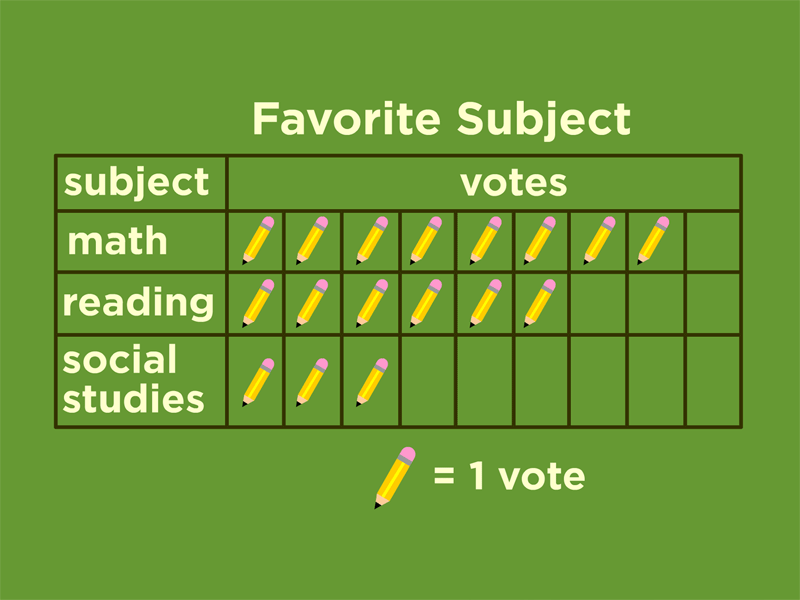
Which subject received the most votes?
a)
science
b)
reading
c)
social studies
d)
math
16.
What type of graph is this?
a)
Bar Graph
b)
Line Plot
c)
Pictograph
d)
Tally Chart
17.
How many students' favorite color is blue?
a)
11
b)
12
c)
14
d)
17
18.
How many students like vanilla and chocolate?
a)
8
b)
32
c)
30
d)
28
19.
How many students take the bus to school?
a)
35
b)
20
c)
10
d)
15
20.

How many votes for Art?

a)

2

b)

3

c)

6

d)

8

21.
Which subject received the most votes?
a)
science
b)
reading
c)
social studies
d)
math
22.

How many strawberries does Ed have?

a)

2

b)

20

c)

6

d)

4

23.

How many strawberries do Ed and George have together?

a)

5

b)

10

c)

9

d)

13

24.

Which food was the most popular food?

a)

Pizza

b)

Breakfast

c)

Chicken nuggets

25.

How many students liked Milk and Hot Cocoa? (Count them all together)

a)

10

b)

12

c)

9

26.

What is the title of this graph?

a)

Our Shoe Graph

b)

Favorite Cookie

c)

My Favorite Color

27.

How many more children chose bananas than apples?

a)

3

b)

5

c)

7

d)

2

28.

Which fruit was chosen by the fewest children?

a)

banana

b)

pear

c)

strawberry

d)

apple

29.

How many children love grapes and strawberries?

a)

6

b)

9

c)

8

d)

7

30.

How many children in all chose a favorite fruit?

a)

20

b)

21

c)

19

d)

18

31.

What is the most popular ice cream choice of this class?

a)

chocolate

b)

vanilla

c)

strawberry

32.

How many more kids liked strawberry ice cream, than chocolate ice cream?

a)

2

b)

3

c)

1

33.

What is the most popular fruit?

a)

bananas

b)

apples

c)

oranges

34.

how many students are in this class? 6+3+4=6+3+4=  

(a)