
 Worksheets
Circle Graph exit ticket
Total questions: 10
Worksheet time: 18mins
Name
Class
Date
1.

What percentage does the entire circle graph represent?
a)
100%
b)
50%
c)
25%
d)
15%
2.

The pie chart shows the percent of students with different footwear. Estimate the percent of students who wear sneakers.
a)
22%
b)
11%
c)
32%
d)
30%
3.

The circle graph shows the percentage of names. What is the percentage of people named Kaias?
a)
60%
b)
25%
c)
50%
d)
75%
4.
The circle graph shows the percentage of names. What is the percentage of people named Tony?
a)
60%
b)
25%
c)
50%
d)
75%
5.

The pie chart shows the colors of crocks in a store. What percent of the crocs are pink?
a)
5%
b)
20%
c)
155%
d)
45%
6.

According to this circle graph, what is the least popular flavor of Jolly Rancher?
a)
Blue Rasberry
b)
Watermelon
c)
Grape
d)
Apple
7.

Which table represents the data in the graph?
a)
b)
c)
d)
8.

According to this circle graph, what is the least popular flavor of Jolly Rancher?
a)
Blue Rasberry
b)
Watermelon
c)
Grape
d)
Apple
9.
What are the sections within a circle graph called?
a)
Sections
b)
Parts
c)
Sectors
d)
Pieces
10.
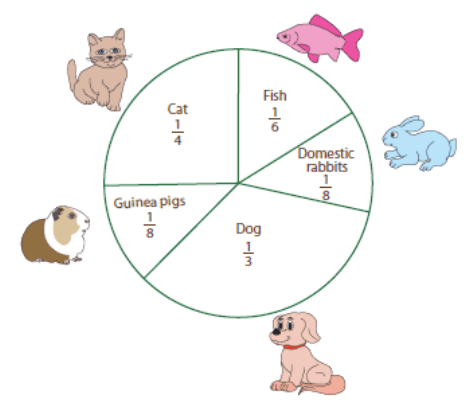
There are 24 animals in Bob's neighborhood. How many cats are in the neighborhood?
a)
3
b)
4
c)
6
d)
8
100 %

