
NEW
Font size
S
M
L
XL
 Worksheets
Reading a bar graph
Total questions: 10
Worksheet time: 20mins
Name
Class
Date
1.

Which lunch choice was the least favorite?
a)
Hot Dog
b)
Pizza
c)
Submarine Sandwich
d)
Hamburger
2.

How many votes did softball and basketball have altogether?
a)
6
b)
4
c)
10
d)
2
3.

How many more bananas were there than apples?
a)
8
b)
4
c)
6
d)
2
4.

Which juice color recieved 10 votes?
a)
Yellow
b)
Purple
c)
Orange
d)
Red
5.
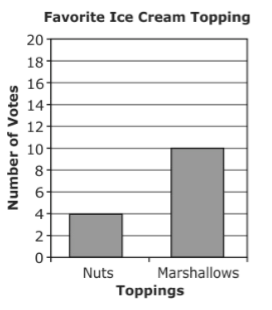
Students voted for their favorite ice cream topping. How many more students chose marshmallows than chose nuts?
a)
4
b)
6
c)
10
6.

The graph shows the number of colored beads used to make a necklace. How many purple and green beads were used in all?
a)
23
b)
20
c)
18
d)
15
7.

The bar graph shows the number of hamburgers sold at Bob’s Burger Shack. On which days were more than 80 hamburgers sold?
a)
Wednesday and Friday
b)
Tuesday and Thursday
c)
Monday, Tuesday, and Thursday
d)
Tuesday, Wednesday, Thursday, and Friday
8.

How many people voted for red as their favorite color?
a)
100
b)
2
c)
4
d)
9
9.
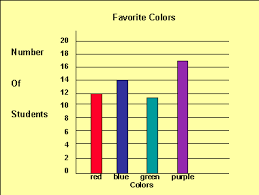
What type of graph is this?
a)
Bar Graph
b)
Line Plot
c)
Pictograph
d)
Tally Chart
10.

Look at the Bar Graph "Student Grades". Which grade did the smallest number of students get?
a)
A
b)
B
c)
C
d)
D
Reset

