
 Worksheets
probability
Total questions: 32
Worksheet time: 1hrs 6mins
Name
Class
Date
1.
A die is rolled once. What is the probability of rolling a 5? Your answer should be a fraction in simplest form.
a)
1/6
b)
1/3
c)
2/5
d)
5/6
2.
A die is rolled once. What is the probability of rolling an odd number? Your answer should be a fraction in simplest form.
a)
1/6
b)
1/2
c)
3/6
d)
2/5
3.
A die is rolled once. What is the probability of rolling NOT a 4? Your answer should be a fraction in simplest form.
a)
4/6
b)
1/6
c)
1/5
d)
5/6
4.
Probability is ...
a)
the chance that some event will occur.
b)
a game that involves coins.
c)
a guarantee.
5.
A jar contains 2 pink, 6 red, and 4 blue marbles. If you pick one marble without looking, what is the probability that the marble you pick will be red or blue?
a)
5/6
b)
1/2
c)
1/3
d)
1/6
6.

What is the probability of landing on the orange section?
a)
1/4
b)
1/2
c)
2/4
d)
3/4
7.
An automobile dealer decides to select a month for its annual sale. Find the probability that it will be September or October.
a)
1/12
b)
1/6
c)
1/4
d)
5/6
8.
Ben has a basket of 5 red balls, 3 yellow balls, and 2 green balls. What is the probability that the probability he randomly chooses will be red?
a)
1/2
b)
1/5
c)
1/10
d)
5/8
9.

How many people ate pepperoni pizza for lunch?
a)
15
b)
21
c)
6
d)
12
10.

How many senior boys play football AND wrestle?
a)
9
b)
12
c)
18
d)
39
11.

How many senior boys play football but do not wrestle?
a)
9
b)
12
c)
18
d)
104
12.

How many senior boys play football OR wrestle?
a)
9
b)
21
c)
30
d)
39
13.

What does the shaded portion of the Venn diagram represent?
a)
Band and Art
b)
Only Art
c)
Band or Art
d)
Neither
14.

Identify the shaded area...
a)
A
b)
B
15.

Find the probability of getting a red shape.
a)
95
b)
93
c)
31
16.
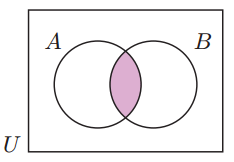
What statement does the shaded region represent
a)
A or B
b)
Not A
c)
A and B
d)
Not B
17.

According to the two-way table, a person who plays an instrument is most likely to:
a)
Not play an instrument
b)
Not play a team sport
c)
Play a team sport
d)
All of the above
18.

How many chemical engineers chose Science as their favorite subject?
a)
80
b)
91
c)
171
d)
262
19.

What percentage of males drive sports cars?
a)
35%
b)
16.25%
c)
65%
d)
25%
20.
According to the two-way table, a person who plays an instrument is most likely to:
a)
Not play an instrument
b)
Not play a team sport
c)
Play a team sport
d)
All of the above
21.

According to the table, what is the relative frequency of students ages 10 - 13 who eat breakfast?
a)
About 33%
b)
About 50%
c)
About 40%
d)
About 44%
22.
How many chemical engineers chose Science as their favorite subject?
a)
80
b)
91
c)
171
d)
262
23.

Of the mechanical engineers, what is the probability that math is their favorite subject?
a)
1.91
b)
52%
c)
17%
d)
35%
24.

What percentage of the days that it rained, did they forecast no rain?
a)
About 20%
b)
About 18%
c)
About 14%
d)
About 12%
25.

What percentage of the students were boys?
a)
20%
b)
25%
c)
40%
d)
50%
26.

Identify the join relative frequency of boys that have blond hair.
a)
.4
b)
0.1
c)
0.44
d)
0.2
27.

Out of those surveyed, what is the probability that the student is a boy who can't bike to school (in simplest form)?
a)
4/30
b)
7/30
c)
2/15
d)
14/30
28.
What type of data are jersey numbers?
a)
Quantatative
b)
Categorical
29.
All senior from a college are asked if they have secured a job and whether it relates to their major.
a)
Sample
b)
Population
30.

A student is picked at random.
What is the probability the student is female?
a)
31/72
b)
41/72
c)
42/72
d)
30/72
31.
A student is picked at random.
What is the probability the student is female who studies French?
a)
18/72
b)
24/72
c)
13/72
d)
17/72
32.
A student is picked at random.
What is the probability the student is male who studies French?
a)
18/72
b)
24/72
c)
13/72
d)
17/72
100 %

