
 Worksheets
Functions & Properties REVIEW
Total questions: 125
Worksheet time: 4hrs 1mins


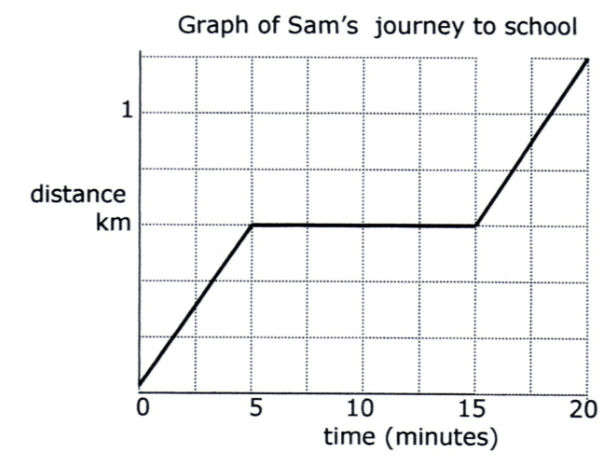
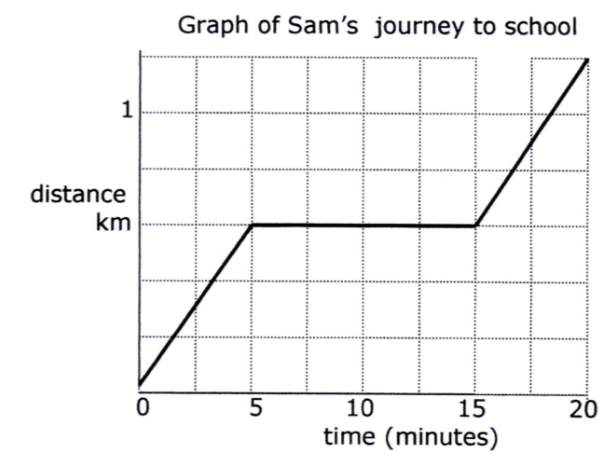


What is the increasing interval for the function below?
(−∞,∞)
(−∞,2]
(−∞,6]
(−6,6)

What is/are the increasing interval(s) for the function shown?
(−3, 1)
(4, 8)
(−∞,1) ∪ (−3, 1)
What is/are the increasing interval(s) for the function shown?
(4, 8)
(−3, 1)
(−∞,1) ∪ (−3, 1)
(−∞, 1) ∪ (4, 8)
What is/are the decreasing interval(s) for the function shown?
(2, 4) ∪ (8, ∞)
(−∞, 1) ∪ (8, ∞)
(−∞,1)∪ (−3, 1) ∪ (8, ∞)
(−∞, 1) ∪ (2, 4) ∪ (8, ∞)

What is the decreasing interval(s) on the function shown?
(−7, −6) ∪ (−2, 4)
(−7, 0) ∪ (−2, 4)
(−7, −6) ∪ (−2, 0)
(−7, 0) ∪(4, 5)

What is the increasing interval on the function shown?
(−∞, 1)
(−∞, 2)
(2, ∞)
(1, ∞)
What is the decreasing interval on the function shown?
(−∞, 1)
(−∞, 2)
(2, ∞)
(1, ∞)

What is the decreasing interval on the function shown?
(−∞, −3)
(−∞, −4)
(−4, ∞)
(−3, ∞)
What is the increasing interval on the function shown?
(−∞, −3)
(−∞, −4)
(−4, ∞)
(−3, ∞)

What is the increasing interval(s) on the function shown?
(−∞, −15)∪(9, −15)
(−2, 9) ∪ (2, ∞)
(−∞, −2)∪ (0, 2)
(−2, 0)∪ (2, ∞)
What is the decreasing interval(s) on the function shown?
(−∞, −15) ∪ (9, −15)
(−2, 9) ∪(2, ∞)
(−∞, −2)∪(0, 2)
(−2, 0)∪ (2, ∞)

A roller coaster park is open from May to October each year. The graph shows the number of park visitors each day over the course of its season.
Describe what Segment 1 means in the context of this situation?
The attendance during the first weeks of May was constant (the same number of people visited each day).
The attendance increased very quickly over this period of time.
The attendance decreases over this period of time.
The attendance increases slowly and comes to a peak at the end of this period of time.
A roller coaster park is open from May to October each year. The graph shows the number of park visitors each day over the course of its season.
Describe what Segment 2 shows in this context.
The attendance during the first weeks of May was constant (the same number of people visited each day).
The attendance increased very quickly over this period of time.
The attendance decreases over this period of time.
The attendance increases slowly and comes to a peak at the end of this period of time.
A roller coaster park is open from May to October each year. The graph shows the number of park visitors each day over the course of its season.
What happens during segment 3?
The attendance during the first weeks of May was constant (the same number of people visited each day).
The attendance increased very quickly over this period of time.
The attendance decreases over this period of time.
The attendance increases slowly and comes to a peak at the end of this period of time.
A roller coaster park is open from May to October each year. The graph shows the number of park visitors each day over the course of its season.
What happens during segments 4 and 5?
The attendance during the first weeks of May was constant (the same number of people visited each day).
The attendance increased very quickly over this period of time.
The attendance decreases over this period of time.
The attendance increases slowly and comes to a peak at the end of this period of time.

Oliver is hiking a trail that takes him straight up a mountain. He starts his hike at 8 am at the base of the mountain. The distance, d, in miles, that Oliver is from the base of the mountain t hours after starting his hike is shown in the graph.
Between what times is the slope of the graph positive?
The slope of the graph is positive between x = 0 and x = 3 and also between x = 5 and x = 7
The slope is positive between x = 3 and x = 5
Oliver is hiking a trail that takes him straight up a mountain. He starts his hike at 8 am at the base of the mountain. The distance, d, in miles, that Oliver is from the base of the mountain t hours after starting his hike is shown in the graph.
What does it mean to have a positive slope in this context?
Oliver is hiking up the mountain
Oliver is hiking down the mountain
Oliver is taking a break from hiking
Oliver is hiking a trail that takes him straight up a mountain. He starts his hike at 8 am at the base of the mountain. The distance, d, in miles, that Oliver is from the base of the mountain t hours after starting his hike is shown in the graph.
What does it mean to have a 0 slope in this context? (between x = 3 and x = 5 the slope is 0)
Oliver is hiking up the mountain
Oliver is hiking down the mountain
Oliver is taking a break from hiking

Antonio and Juan are in a 4-mile bike race. The graph shows the distance of each racer, in miles, as a function of time, in minutes.
Who wins the race? How do you know?
Juan because he gets to 4 miles first (x = 13)
Antonio because he gets to 4 miles first (x = 15)
they tie because they both get to 4 miles at the same time

The figure below gives the depth of the water at Montauk Point, New York, for a day in November.
How many high tides took place on this day?
1
2
3
0
The figure below gives the depth of the water at Montauk Point, New York, for a day in November.
How many LOW tides took place on this day?
1
2
3
0

Find the local maximum and minimum
Local max at x = -3
Local min at x = -3
Local max at x = 1
Local min at x = -3
Local max at x = -3
Local min at x = 1
(−∞, ∞)

Identify the local minimum
x = 8
x = 4
∞
x = 2

Identify the global (or absolute) maximum.
-2
1
∞
−∞

What is the location of the absolute maximum for the graphed function?
x = 1
x = 3
x = 4
x = 5
Does Not Exist
What is the value of the absolute minimum for the following function?
f(x)=(x−2)2−4x = -4
x = 0
x = 2
x = 4
Does Not Exist

What is the location of the relative maximum within the given interval of the graphed function?
−5≤x≤0x = -4
x = -2
x = 0
x = 3
Does Not Exist

What are the extrema of the graph?
Max = (2, -3), (1, 2)
Min = (-3, -1), (-1, 4)
Max = (-3, -1), (-1, 4)
Min = (2, -3), (1, 2)
Max = (-1, -3), (4, -1)
Min = (-3, 2), (2, 1)
Max = (-3, 2), (2, 1)
Min = (-1, -3), (4, -1)

How many extrema are there in this graph?
2 max, 2 min
3 max, 2 min
2 man, 3 min
3 increasing intervals, 2 decreasing intervals
2 increasing intervals, 3 decreasing intervals

How many extrema (max and mins) are in the picture?
2
3
4
5

What is the relative max?
x = 0
x = -2.55
(-∞, ∞)
None

Write the inequality in interval notation.
[-4, -1)
(-4, -1)
(-4, -1]
[-4, -1]
Write the following in interval notation
-7 ≤ x < 8
(-7, 8)
[-7, 8)
[-7, 8]
(-7, 8]
Write the following in interval notation
x < 8
[8, ∞)
(8, -∞)
(-∞, 8]
(-∞, 8)

Look at the graph. Write the interval notation for the graph.
(-2,5)
(-∞,-2)⋃(5,∞)
[-2,5]
(-∞,-2]∪[5,∞)
with infinity?

What interval notation does the number line graph represent?
[∞, -5)
(∞, -5)
[-5, ∞)
(-5, ∞)

What inequality is graphed?
2 < x < 4
2 ≤ x ≤ 4
x > 2 or x < 4
x ≥ 2 or x ≤ 4

Write the interval notation for the graph?
[-3, 2)
-3<x<2
(-∞, -3] U (2, ∞)
x > 2 or x < -3
-8 ≤ x < 8
-9 < x ≤ -4

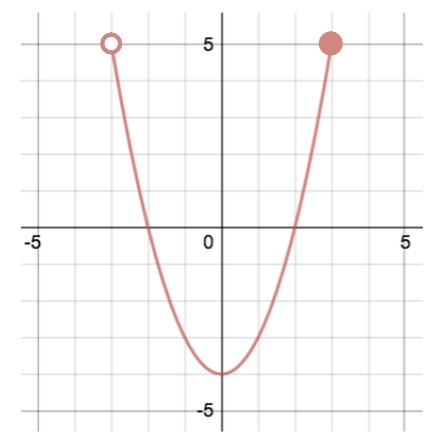


What is the range of the graph?
[-15, 9]
(-∞, ∞)
(-15, ∞)
[-15, ∞)
x < 8
The set of all y-values used to graph a function are called the ____.
Domain
Range
Relation
Function
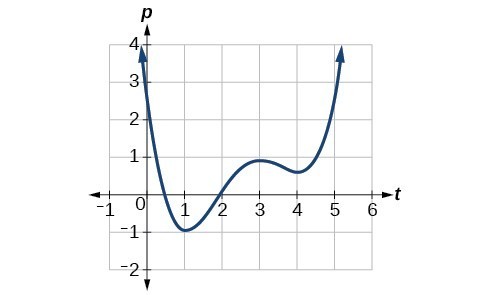
In interval notation, positive and negative ∞ are always closed in by ______.
( ) Parentheses
[ ] Square Brackets
{ } Curly Brackets
In set notation, the infinity symbols are not used. Instead "_____" is used to represent a graph that uses all real numbers.
R
Z
I
A
DOMAIN is found by reading the ends of a graph from ___ to ___.
Right to left
Left to right
Bottom to top
Top to bottom
RANGE is found by reading the ends of a graph from ___ to ___.
Right to left
Left to right
Bottom to top
Top to bottom
The set of all x-values used to graph a function are called the ____.
Domain
Range
Relation
Function
Write the following range in set builder notation:
(4, ∞).
{y | y > 4}
{y | y > 4}
{x | x < 4}
{x | x > 4}
Given {x| x ≥ 6}, the domain of a function in set builder notation, which of the following rewrites it in interval notation?
(6, ∞)
[6,∞)
(−∞,6)
(−∞,6]


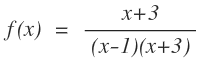
Find the vertical asymptotes and holes of the function.
Holes: None;
VA: x = 1, -3
Holes: x = -3;
VA: x = 1
Holes: x = -3, 1
VA: None
Holes: x = 1
VA: x = -3
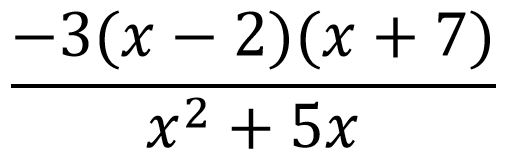
x2- 9x+20
___________
4x2 - 12x- 40

Where is there a hole on the graph of the function?
x = 2
x = -2
There are no holes.
x = 5

How many vertical asymptotes does the function have?
None
1
2
3
Find the vertical asymptotes and holes of the function.
Holes: None;
VA: x = 1, -3
Holes: x = -3;
VA: x = 1
Holes: x = -3, 1
VA: None
Holes: x = 1
VA: x = -3

State the vertical asymptote.
x = -2/5
x = -5/2
x = -5
x = 2

Find the coordinates of the hole.
(-3, -3)
(-3, 3)
(3, -3)
(3, 3)
Where is the hole?
x= 4
x= -4
x= 5
x= -5


What is the domain of this graph?
x≥0 ( [0, ∞) )
x<0
All real numbers ( (−∞, ∞) )
None of the above

What is the range of this parent graph? Choose the best answer.
All nonnegative numbers y≥0 ([0, ∞))
All real numbers ( (−∞, ∞) )
All negative numbers y<0 ((−∞, 0))
All of the above

What is the range of this graph?
y≥0 ( [0, ∞) ) (nonnegative numbers)
All real numbers (−∞, ∞)
All negative numbers ( y<0 ) ( (−∞, 0)
None of the above

What is the range of the function?
All negative numbers and/or 0 ( y≤0 ) (−∞, 0]
Nonnegative numbers y≥0 [0, ∞)
All real numbers (−∞, ∞)
All numbers x=0

What is the end behavior as x→−∞ ?
f(x)→∞
f(x)→−∞
f(x)→0
None of the above

What is the end behavior as x→−∞ ?
f(x)→0
f(x)→∞
f(x)→−∞
f(x)→9

What is the end behavior as x→−∞ ?
f(x)→−2
f(x)→−∞
f(x)→0
f(x)→∞

What is the domain of this graph?
x≥0 ( [0, ∞) )
All x>0
All real numbers ( (−∞, ∞) )
None of the above

Determine the boundedness of the function graphed.
Bounded Above
Bounded Below
Bounded
Unbounded

Determine the boundedness of the function graphed.
Bounded Above
Bounded Below
Bounded
Unbounded

Determine the boundedness of the function graphed.
Bounded Above
Bounded Below
Bounded
Unbounded

Determine the boundedness of the function graphed.
Bounded Above
Bounded Below
Bounded
Unbounded

Determine the boundedness of the function graphed.
Bounded Above
Bounded Below
Bounded
Unbounded

Determine the boundedness of the function graphed.
Bounded Above
Bounded Below
Bounded
Unbounded

Determine the boundedness of the function graphed.
Bounded Above
Bounded Below
Bounded
Unbounded

Determine the boundedness of the function graphed.
Bounded Above
Bounded Below
Bounded
Unbounded

Determine the boundedness of the function graphed.
Bounded Above
Bounded Below
Bounded
Unbounded

Determine the boundedness of the function graphed.
Bounded Above
Bounded Below
Bounded
Unbounded


Determine algebraically: Is the function even, odd, or neither?
f(x) = 4x3
Even
Odd
Neither
Determine algebraically: Is the function even, odd, or neither?
f(x) = x2 + 2
Even
Odd
Neither
Determine algebraically: Is this an even, odd, or neither function?
f(x) = x4 + x2
Even
Odd
Neither

Is the table even, odd or neither?
Even
Odd
Neither

Is the table even, odd or neither?
Even
Odd
Neither
Which table is odd?


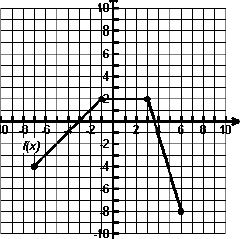

Given the function f(x) = x2+2x+10, find f(3).
3
20
22
25
Determine algebraically if each of the following functions is even, odd, or neither. f(x) = x5-5x3+1
even
odd
neither
Determine algebraically if each of the following functions is even, odd, or neither. f(x) = 2x4+x2-6
even
odd
neither



