
 Worksheets
Unit 7 Data
Total questions: 32
Worksheet time: 2hrs 36mins


Which shape was the least favorite?


How many students own a cat?
2
4
5

The bar graph shows the number of tokens earned by each house in Mrs. Martin's class.
Based on the data which statement is true?
The blue house earned more tokens than the red and yellow houses combined.
The red house earned more tokens than the yellow house.
The orange house earned the most tokens.
The yellow house earned the least tokens.

The graph shows the number of farm animals on Nate's farm.
How many more sheep are there than horses and pig combined?
4
1
2
6

How many students like vanilla and chocolate?
8
32
30
28

Jack made this graph to show the number of movies that were rented from his store during four months.
How many more movies were rented in December than in September?
20
35
45
80
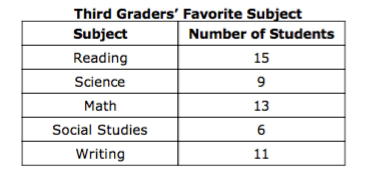
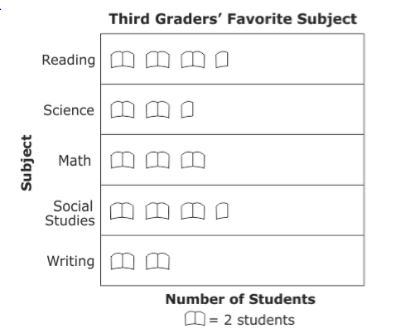
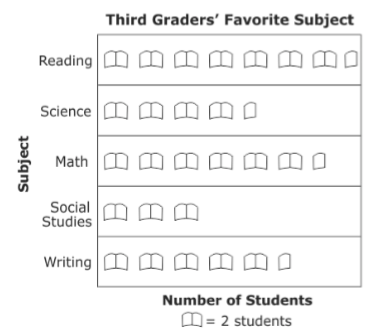
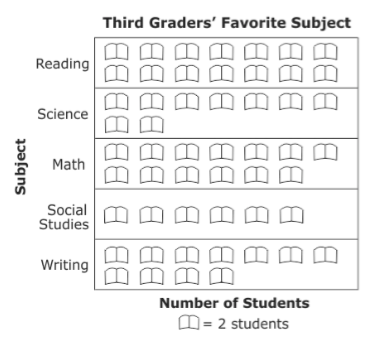
Students in 3rd grade collected data on their favorite subject and recorded it on the table shown. Which graph shows this information?

How many more students play basketball than hockey?
60
10
2
20


9
10
8




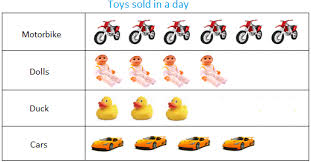


How many strawberries does Ed have?
2
20
6
4

Rita went bird watching. The picture graph below shows the number and types of birds she saw. Which data set was used to make this graph?


How many people like Peanut Butter Cookies?
5
6
4
7

What is the title of this graph?
Our Shoe Graph
Favorite Cookie
My Favorite Color

How many students are in the class based on this graph?
(a)

How many maple trees were planted?
4
6
8
10
How many more pine trees were planted than ash trees?
2
4
6
8
How many more pine trees were planted in all?
14
15
28
30
What does the key word "fewer" tell you to do?
add
subtract
multiply
divide
What does the key word "altogether" tell you to do?
add
subtract
multiply
divide
What does the key word "in all" tell you to do?
add
subtract
multiply
divide

How many students like oranges the best?
2
40
25
10

