
NEW
Font size
S
M
L
XL
 Worksheets
Line chart
Total questions: 15
Worksheet time: 17mins
Name
Class
Date
1.

What is the name of this graph?
a)
line plot
b)
line graph
c)
bar graph
d)
frequency table
2.

How many push-ups were done on Monday?
a)
5
b)
10
c)
15
d)
20
3.

When was the greatest amount of shoppers at the store?
a)
10am
b)
1pm
c)
6pm
d)
2pm
4.

What was the bear population in 2001?
a)
40
b)
45
c)
50
d)
55
5.
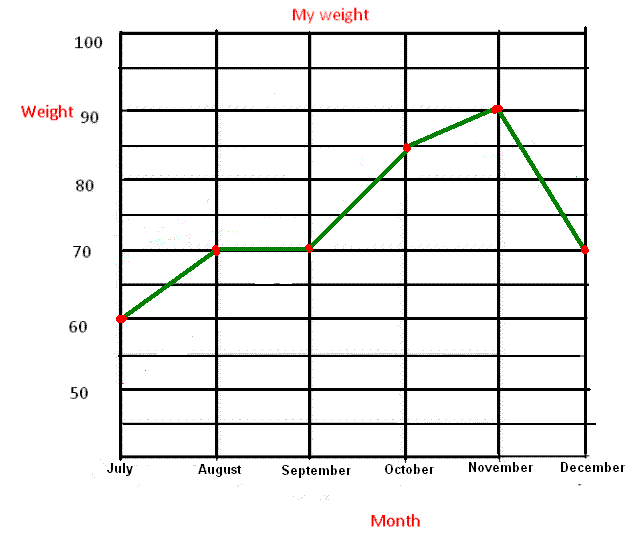
In which month was my weight the highest?
a)
July
b)
September
c)
November
d)
December
6.

Which month did the restaurant sell 40 pizzas?
a)
March
b)
May
c)
July
d)
August
7.

In which month the sale increased
a)
July
b)
June
c)
May
d)
August
8.

How many centimeters of rain fell on the third day?
a)
2
b)
3
c)
4
d)
7
9.

How many use cellphones at the age of 17
a)
341
b)
590
c)
430
d)
530
10.
When was the greatest amount of shoppers at the store?
a)
10am
b)
1pm
c)
6pm
d)
2pm
11.

How many potatoes were grown in 2015?
a)
70
b)
75
c)
50
d)
55
12.
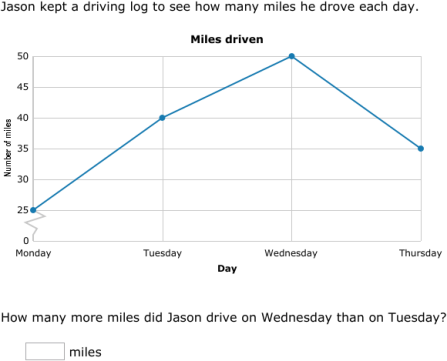
How many more miles did Jason drive on Wednesday than on Tuesday?
a)
40 miles
b)
10 miles
c)
5 miles
d)
50 miles
13.

What is the minimum value in the data shown on the line graph?
a)
70
b)
72
c)
91
d)
100
14.

How many hot dogs were sold altogether?
a)
30 hot dogs
b)
100 hot dogs
c)
180 hot dogs
d)
80 hot dogs
15.

Between which two years did the bear population remain constant or the same?
a)
2004 and 2005
b)
2001 and 2002
c)
2005 and 2006
d)
2000 and 2001
Reset

