
NEW
Font size
 Worksheets
Graph test 1
Total questions: 12
Worksheet time: 12mins
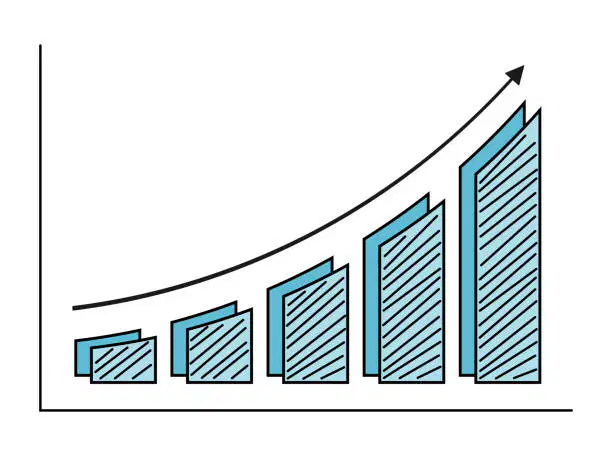
How can this graph be described?
steeply decreases
swiftly rises
suddenly dropped
slowly rallies

What happened with graph from 2009 to 2010?
dramatically climbed
sharply declined
remained flat
stayed steady

Which word can not be used for the graph description?
to slump
to level out
to vary
to bounce back
Choose any word translated as "приблизительно"
steadily
rapidly
gradually
approximately

How can you describe this graph?
It maintains at the same level
It fluctuates enormously
It soars slightly
It shows a downward trend

How can you describe this pie chart?
Category 1 is slightly more than Category 2
Category 1 is just short of Category 2
Category 1 is somewhere in the region of Category 2
Category 1 is a great deal more than Category 2

How can you describe this bar graph?
Initially shows an upward trend, then fallen
Initially collapses, then booms
Initially jumps, then stabilizes
Initially increases, then picks up
Choose one misplaced word.
to expand
to surge
to grow
to deteriorate

Which word can describe the increase of this graph?
steep
sharp
sudden
gradual

Which line shows the stable shrink over all period?
blue one
green one
purple one
red one
Choose any synonym for the word "increase".
reduce
plunge
soar
vary

Over the period from 2005 to 2006 the graph ...
improves slightly
diverges significantly
shows a downward trend
fluctuates around 135

