wayground logo

Free Printable Worksheets

NEW

Font size

S
M
L
XL
Worksheets

Graphs

Total questions: 34

Worksheet time: 2hrs 42mins

Name
Class
Date
1.

The most popular way of going to school is by ___________.

a)

Car

b)

Bus

c)

Walk

2.

3 pupils go to school by __________.

a)

Car

b)

Bus

c)

Walk

3.

There are _______ pupils who do not walk going to school.

a)

14

b)

11

c)

10

d)

4

4.

There are _______ pupils in the class altogether.

a)

15

b)

14

c)

13

d)

12

5.

_________ more pupils like noodles than pie.

a)

7

b)

2

c)

5

d)

12

6.

6 pupils like _________.

a)

burger

b)

noodles

c)

pie

d)

bread

7.

The least popular food is _________.

a)

burger

b)

noodles

c)

pie

d)

bread

8.

There are _______ glasses of lime juice and orange juice altogether.

a)

12

b)

2

c)

9

d)

11

9.

The number of glasses of apple juice is the same as the number of glasses of _______ juice.

a)

Apple

b)

Grape

c)

Lime

d)

Orange

10.
How many students favorite pet was a cat?
a)
5
b)
10
c)
4
d)
15
11.

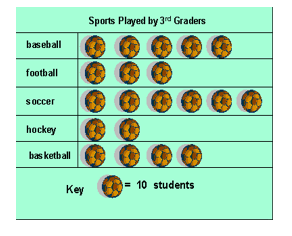
How many students liked basketball?

a)

4

b)

30

c)

40

d)

5

12.

Which fruit was the most favorite?

a)

Apple

b)

Orange

c)

Graph

d)

Banana

13.

Which lunch choice was the least favorite?

a)

Hot Dog

b)

Pizza

c)

Submarine Sandwich

d)

Hamburger

14.

How many more students liked blue balloons than pink?

a)

1

b)

4

c)

7

d)

3

15.
How many days were either rainy or partly cloudy?
a)
8
b)
5
c)
3
d)
7
16.
How many more books did the class read in June than April?
a)
15
b)
25
c)
10
d)
20
17.
a)

5

b)

6

c)

4

18.
a)

2

b)

3

c)

1

19.
How many students take the bus to school?
a)
35
b)
20
c)
10
d)
15
20.
How many more people like red than purple?
a)
100
b)
10
c)
2
d)
5
21.
a)

2

b)

3

c)

1

22.
a)

9

b)

10

c)

8

23.
How many more people like purple than red?
a)
3
b)
5
c)
7
d)
9
24.
How many students like vanilla and chocolate?
a)
8
b)
32
c)
30
d)
28
25.
How many more students like soccer than basketball?
a)
24
b)
15
c)
10
d)
17
26.
How many students voted for their favorite sport?
a)
38
b)
17
c)
40
d)
50
27.

How many more students picked orange or purple juice than yellow juice?

a)

4

b)

6

c)

8

d)

10

28.

How many students were surveyed in all?

a)

21

b)

17

c)

22

d)

23

29.

How many more students picked fruit than crackers and popcorn?

a)

2

b)

5

c)

7

d)

9

30.

Which sport did people like the LEAST?

a)

baseball

b)

soccer

c)

basketball

31.
Which sentence correctly describes the graph?
a)
The fewest people chose grapes.
b)
The most people chose pears.
32.

How many people were surveyed ?

a)

9

b)

10

c)

11

33.
How many people like football and basketball?
a)
9
b)
4
c)
10
d)
2
34.

How many people chose apple and pears as their favorite fruit?

a)

17

b)

15

c)

16

d)

18