
 Worksheets
Graphs
Total questions: 41
Worksheet time: 54mins
Which of the graphs shows that one of runners started 10 yards further ahead of the
other?


In which of the following graphs below are both runners moving at the same speed?


Match the description to the graph:
"The car is stopped."


Match the description to the graph:
"The car is traveling at a constant speed."
Match the description to the graph:
"The car is coming back."

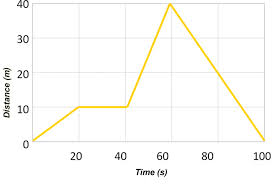
Segment O-A The bus is _________________.
at rest
returning (to original position)
moving forward
Segment A-B The bus is _________________.
at rest
returning (to original position)
moving forward
Segment B-C The bus is _________________.
at rest
returning (to original position)
moving forward

Which runner won the race?
Albert
Bob
Charlie
How long did Charlie stop for a rest?
2.5 seconds
2 seconds
3 seconds
5 seconds
How long did Bob take to complete the race?
17 seconds
12 seconds
14 seconds
15 seconds
Which of the graphs shows that one of runners started in the same place?
Which of the graphs shows that one of runners ended the race 10 yards ahead of the other?







What is the dependent variable on this graph?
Year
Number of Visitors
None of these

What is the general trend of this line graph?
The more you mow, the more money you make
The more you mow, the less money you make
You make the same amount of money regardless of how long you mow

In which year did exactly 60 students have scholarships?
2014
2010
2012

What is this graph showing you?
The worlds population has been growing and will continue to grow
The worlds population was growing but now is decreasing
The worlds population is staying the same

Between which two times was the greatest increase in number of shoppers?
11 AM to 12 PM
1 PM to 2 PM
12 PM to 1 PM


They used their results to make the graph below.
Which month had an average daily temperature of around 41 degrees?

Mikey had two mice that were about the same age and weight. Mikey fed each of the two mice a different feed for a month. He measured how much the mice weighed every two days until the month was over. Mikey's results showed that although both mice gained weight over the month, mouse 2 gained more weight than mouse 1.Which graph below best shows these results?



