
 Worksheets
CMP3 - Data and Statistics
Total questions: 38
Worksheet time: 1hrs 24mins
Calculate the mean.
2, 9, 10, 6, 8
8
4
7
22
3 , 17 , 17 , 11 , 8 , 13 , 5 , 18
67, 74, 95, 98, 98, 99, 102
5, 15, 10, 20, 15, 10, 15


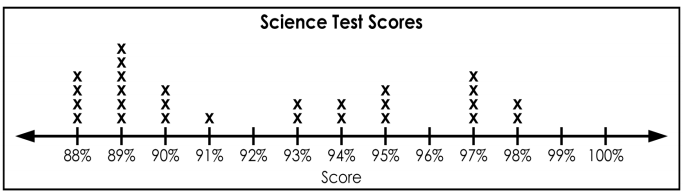
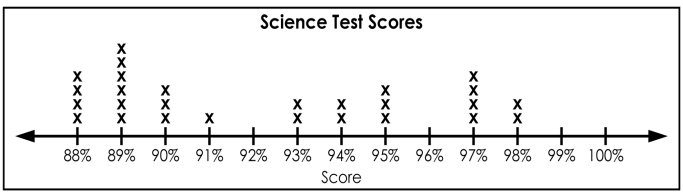


I drew 10 names from a hat containing the names of every student that I teach, what type of sample have I taken?
A random sample.
A biased sample.

Which has a higher median?
Florida
Texas

What is Thanksgivings maximum?
30
15
22
24

Which has a lower IQR? (Interquartile Range)
Week 1
Week 2


How do you find the IQR (Interquartile range)?
add the five number summary
subtract the median from the maximum
subtract the minimum from the maximum
subtract quartile 1 from quartile 3
The "box" contains ALL of the following EXCEPT...
Maximum
Quartile 1
Quartile 3
Median

How many students sent between 10 and 19 text?
25
22
15
45

Which interval contained the fewest scores?
0-9
50-59
both 0-9 and 50-59
10-19

How many vehicles get less than 17 miles per gallon?
20
15
14
25

What percent of female athletes surveyed play basketball?
16%
52%
23%
31%

What percent of basketball players are female?
16%
52%
31%
36%

How many athletes were surveyed in all?
50
150
100
200

What is the range (maximum-minimum) of the data shown?
85
90
80
70
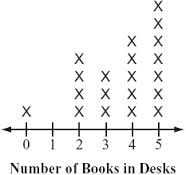
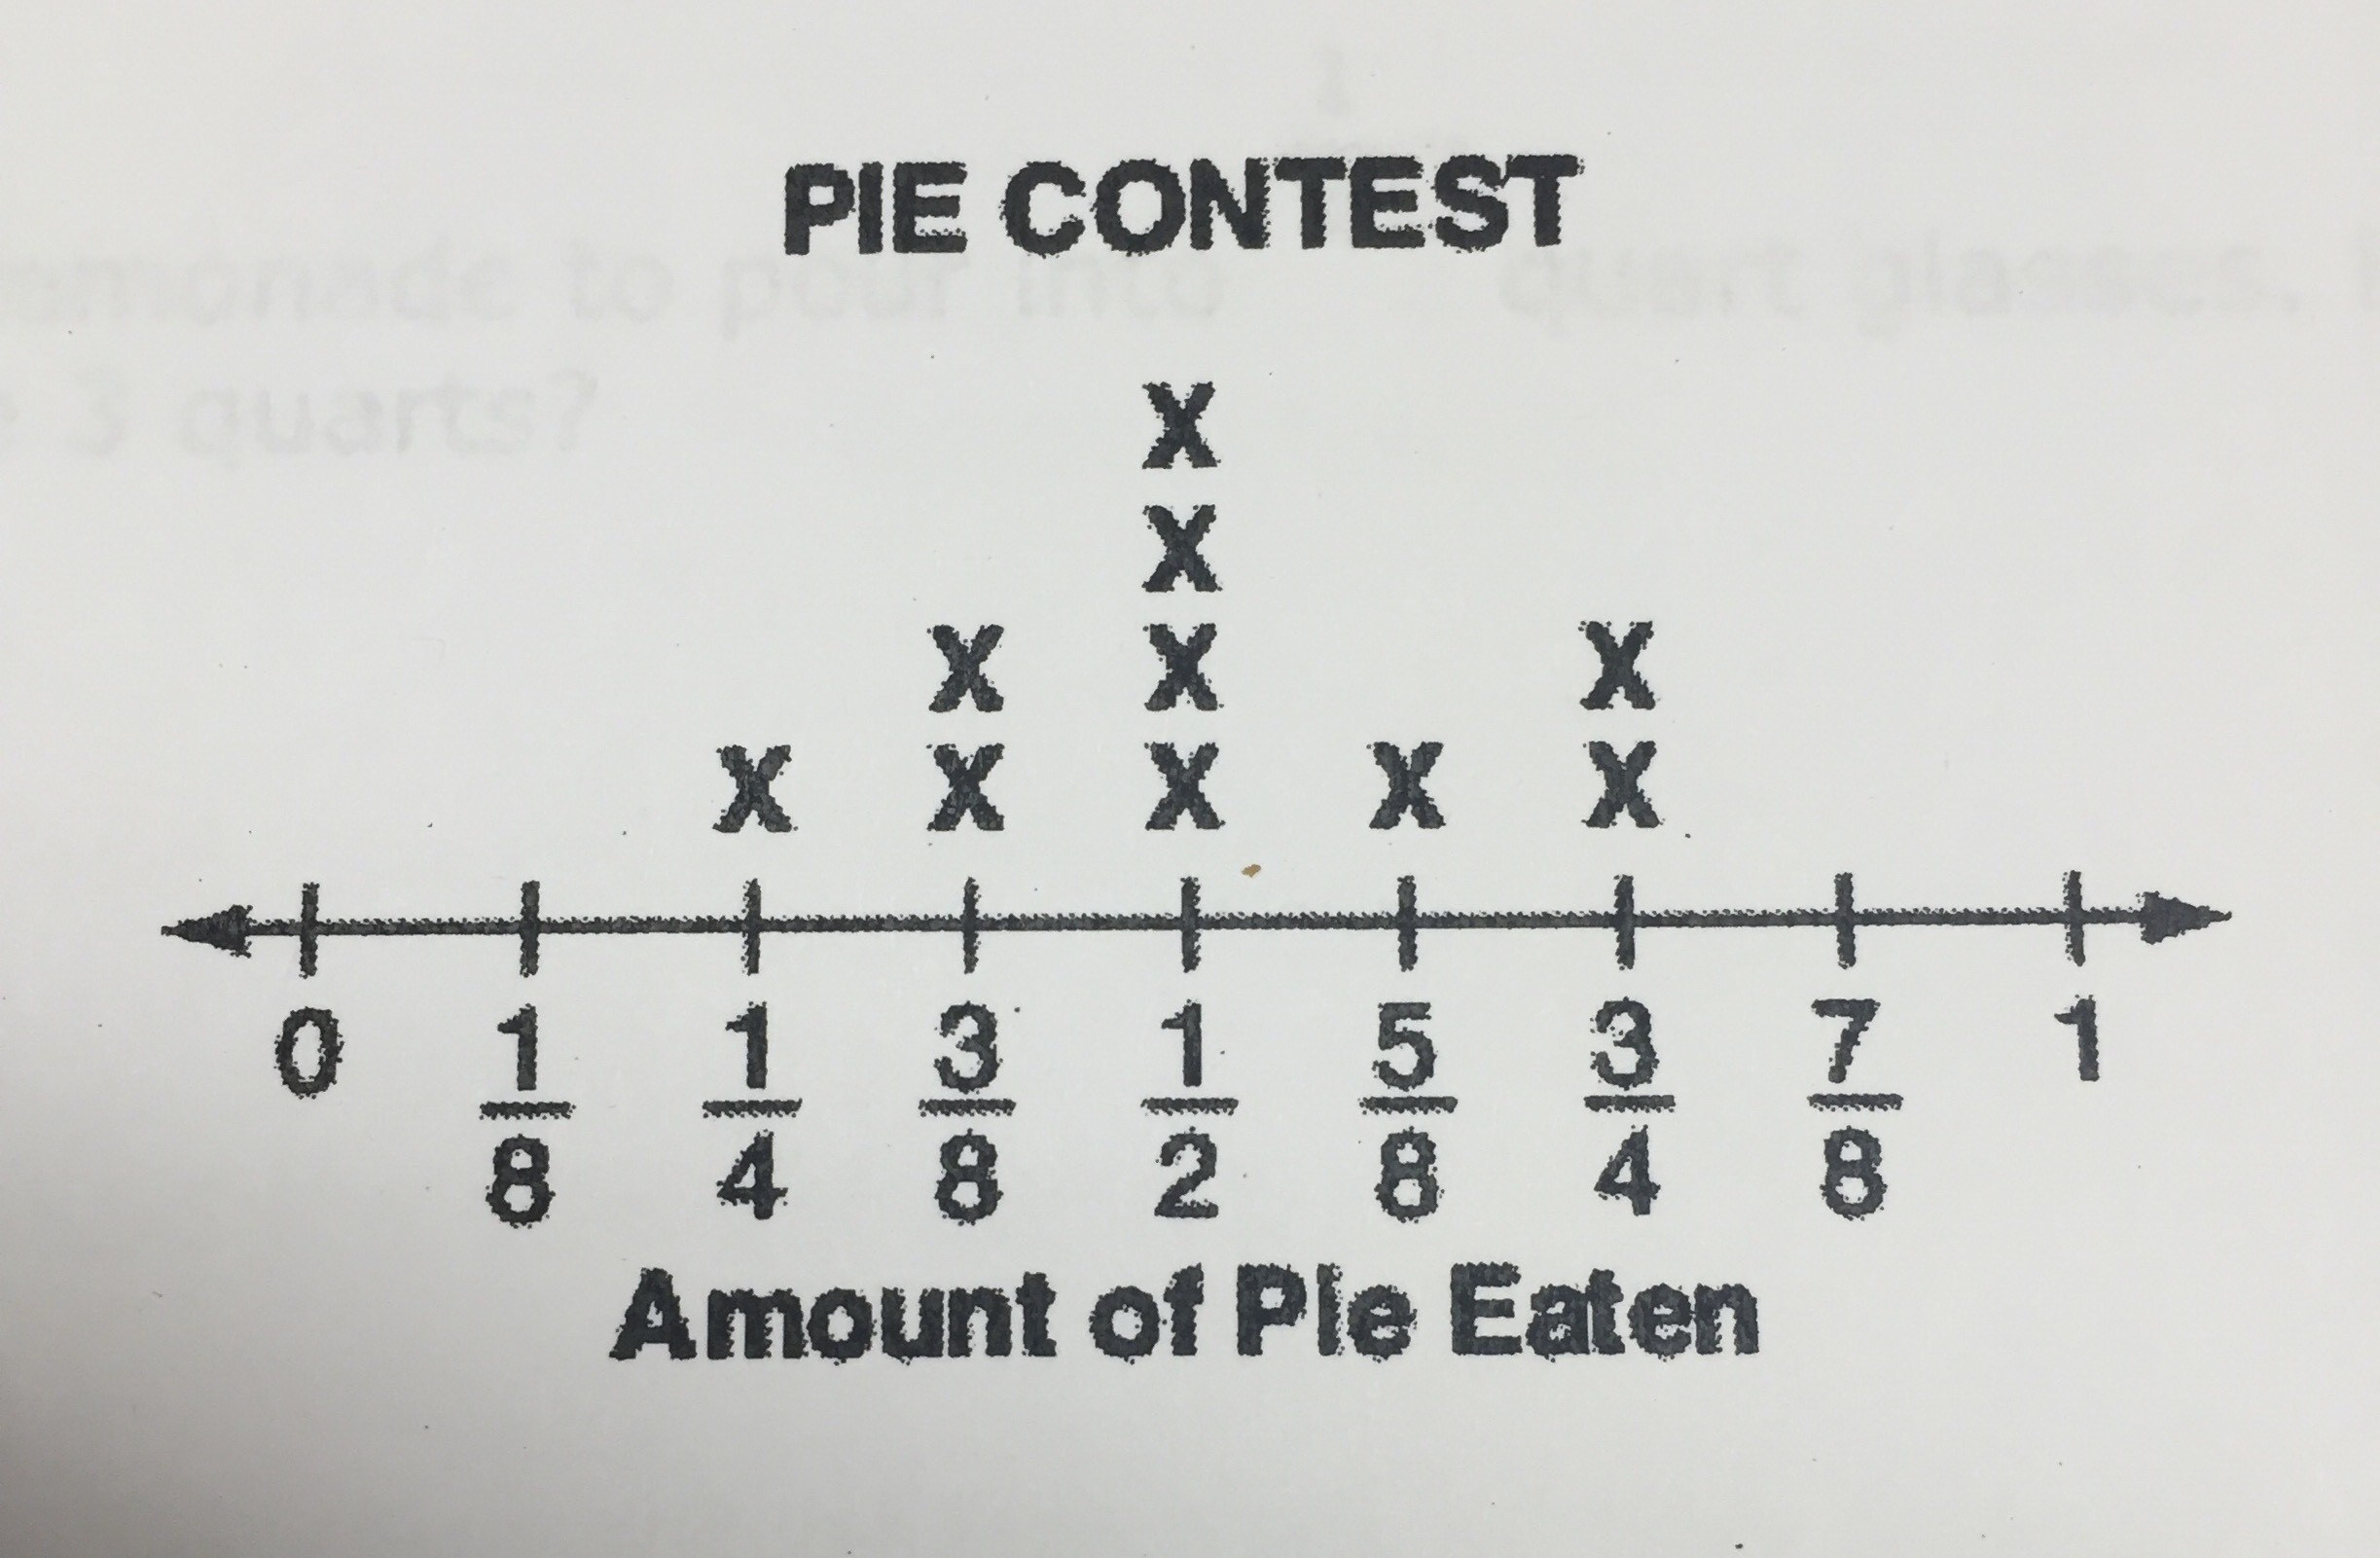
Which box plot represents the data below?
90, 91, 93, 93, 95, 96, 98, 99, 101, 110, 112, 113, 123, 125, 126
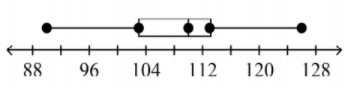
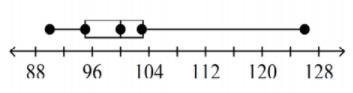
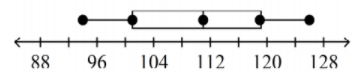
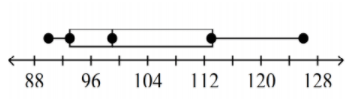
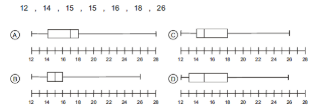
The data shows the heights of students in a class. Which box plot is correct?
A
B
C
D

