
 Worksheets
Speed Time Graphs
Total questions: 15
Worksheet time: 15mins
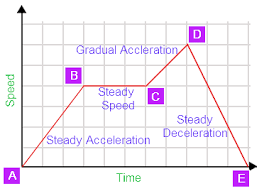
At what point is the speed the greatest?
C-D
B-C
A-B
D-E
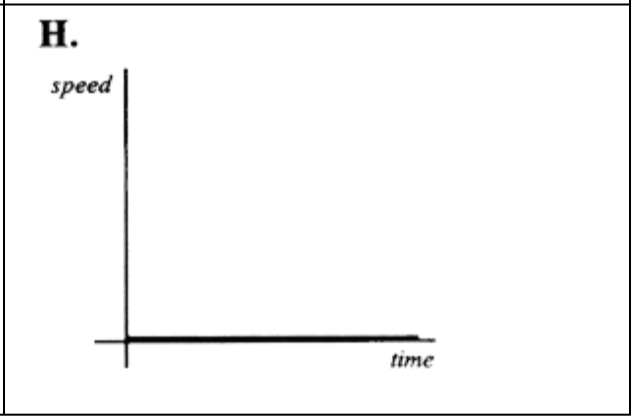
Match the graph to the description:
"The car is slowing down."
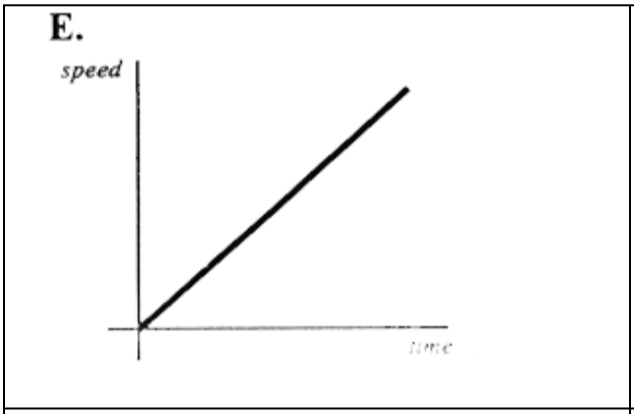
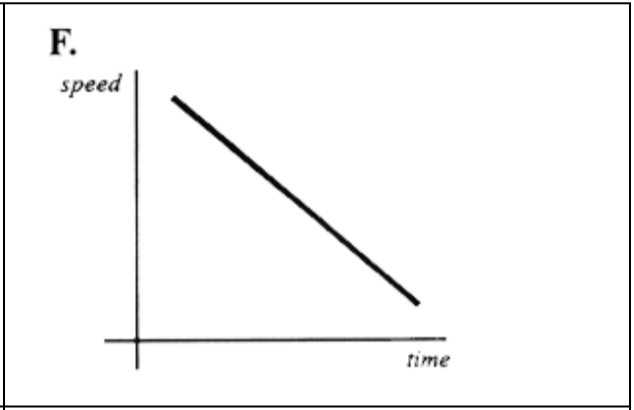
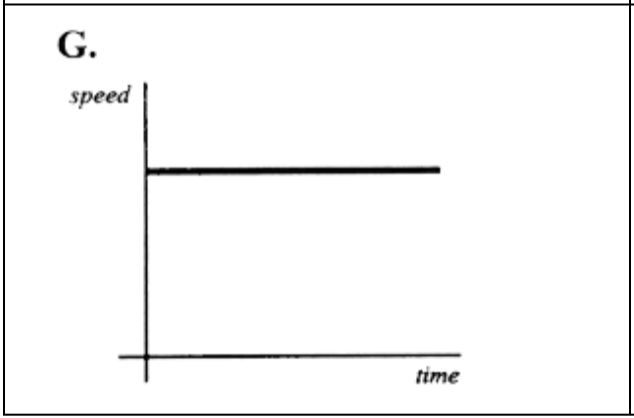
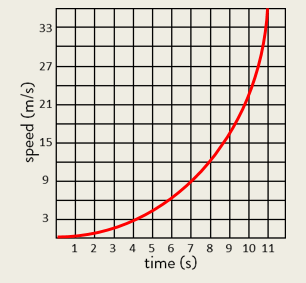
What is this graph showing?
Gradually slowing down
Gradually speeding up
Constant speed
Stopped
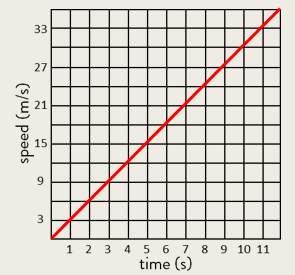
Accelerating gradually
Stopping
Slowing down constantly
Speeding up constantly
Match the graph to the description:
"The car is stopped."
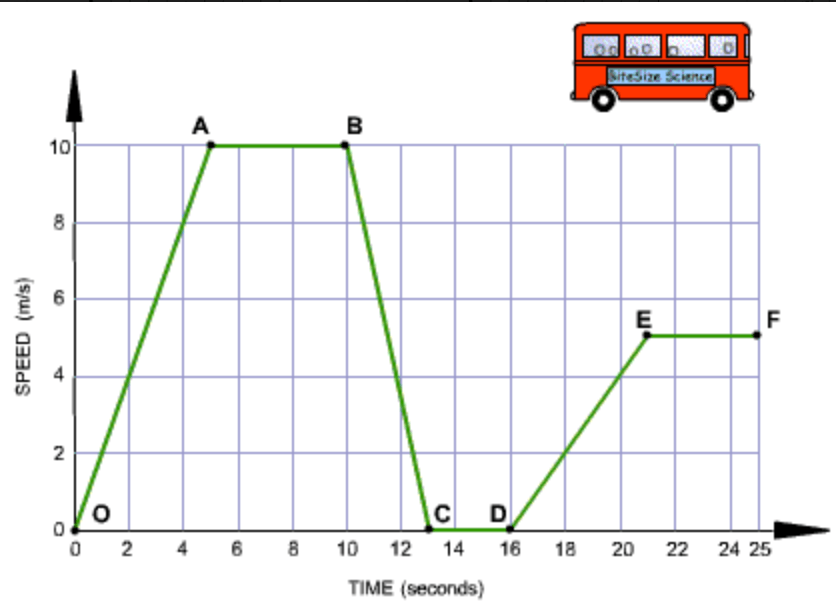
Segment C-D: The bus is _________________. It has stopped.
accelerating
decelerating
constant speed
at rest
Match the graph to the description:
"The car is accelerating speeding up (positive acceleration)."
Segment D-E: The bus is _________________. It is gradually increasing it's speed.
accelerating
decelerating
constant speed
at rest
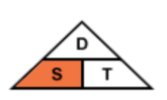
According to the Density Triangle, what is the formula for SPEED?
S = D × T
S = D÷T
S = T ÷D
D = S ×T
D = 10 meters
Time = 2 seconds
What is the Speed?
Hint: S = D÷T
10 m/s
5 m/s
2 m/s
20 m/s
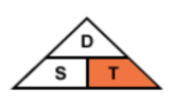
According to the Density Triangle, what is the formula for TIME?
T = D × S
T = S÷D
T = D ÷S
D = S ×T
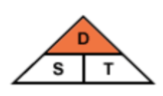
Speed = 20 miles/hour
Time = 2 hours
Distance = ?
Hint: Use the Density Triangle.
40 miles
0.1 miles
20 miles
10 miles
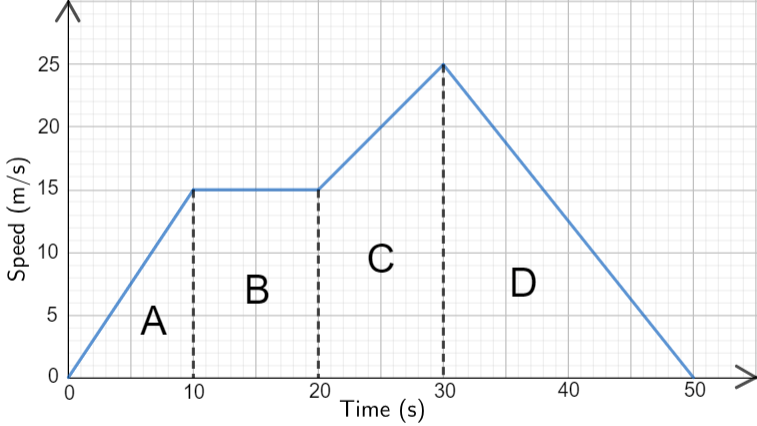
What is happening to the object's speed in section D?
Increasing speed
Decreasing speed
Constant speed
Not moving
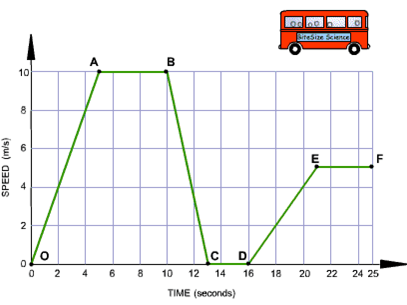
How many seconds did it take for the bus to travel from O to C?
4 sec.
10 sec.
13 sec.
14 sec.

