
 Worksheets
One-Variable Statistics Review
Total questions: 20
Worksheet time: 21mins
The two measures of center we've study this unit are...
Interquartile Range
Mean Absolute Deviation
Mean
Median
Standard Deviation
Interquartile Range or IQR is a measure of variability and helps determine the spread of the data.
True
False
If our data set is skewed to the right or left we would measure the center by calculating the...
Mode
Mean
Median
Range
If we use the mean to measure the typical value or center of the data, we would use the _________ to measure the variability.
IQR
Median
Mean
Standard Deviation
A five number summary includes the minimum, maximum, median, ________ and ___________
Pizza
seltzer water
quarter 1 or Q1
quarter 3 or Q3

Pick the definition of an outlier.
A value that lies outside of most other values in a data set.
A value that is the largest.
A value that is the smallest.
A value that occurs the most.
If outliers are removed, what changes more significantly the mean or median?
Mean
Median

True or False: the mean and median values of shoe sizes shown in the dot plot for Group B are almost the same.
True
False
In a population of five university students with GPAs of 2.5, 2.3, 1.7, 1.4, and 1.1, a sample of three students are considered. What would be the standard deviation of the resulting sampling distribution?
0.53
0.41
0.35
0.22
On a recent test, a statistics professor finds that the mean and median scores are nearly equal. Which of the following could be the distribution of test scores?


None of these is correct

Which restaurant has a greater IQR?
Lucy's Steakhouse
Gary's Grill
They are the same

Which club has the smaller spread, less variation?
Cruisers
Car Hops

4, 2, 7, 4, 3


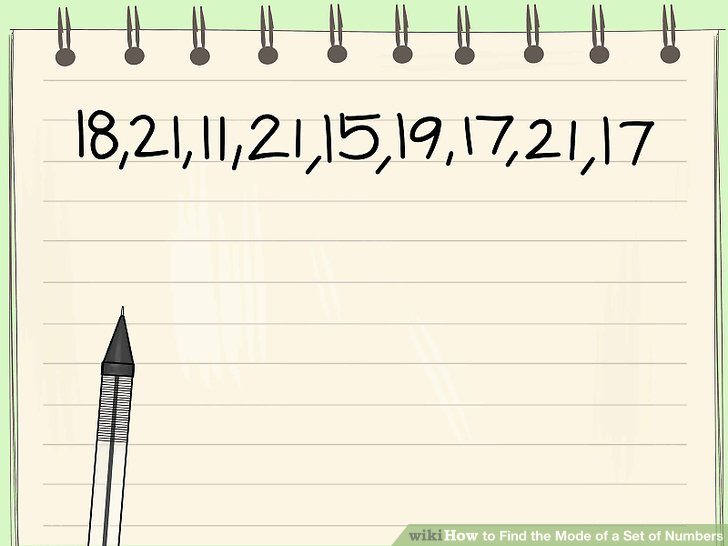
The mean of this data set is 17.8. What would happen to the mean if 40 was added to the data set?
The mean would not change
The mean would go up
The mean would go down
Identify the outlier for the given data, using the formula.
23, 34, 27, 7, 30, 26, 28, 31, 34
7
23
31
34
If we use the median to measure the typical value or center of the data, we would use the _________ to measure the variability.
Mode
MAD
Standard Deviation
IQR or Interquartile Range
Then, 68% of all tires will have a life between ___________ km and __________ km.

