
 Worksheets
Unit 6 Review 1
Total questions: 15
Worksheet time: 1hrs 4mins
Name
Class
Date
1.
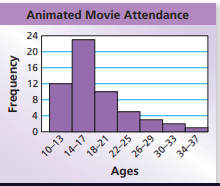
What is the shape of the data?
a)
symmetrical
b)
skewed left
c)
skewed right
d)
bell curve
2.

What is the MODE of this data?
a)
90
b)
85, 90, and 95
c)
85 and 95
d)
None
3.

Which of the following lines represents the line of best fit for the scatter plot?
a)
A
b)
B
c)
C
d)
D
4.

Which of the following lines represents the line of best fit for the scatter plot?
a)
A
b)
B
c)
C
d)
D
5.

Is this line an accurate line estimate of best fit for the data?
a)
Yes
b)
No
6.

Estimate the correlation coefficient
a)
r=-1
b)
r=1
c)
r=-0.5
d)
r=0.5
7.

Describe the relationship between the variables.
a)
Strong positive correlation
b)
Weak positive correlation
c)
Strong negative correlation
d)
Weak negative correlation
8.

Estimate the correlation coefficient.
a)
r=1
b)
r=-1
c)
r=0.5
d)
r=-0.5
9.

Describe the correlation in the graph shown.
a)
Strong Negative
b)
Strong Positive
c)
Weak Negative
d)
Weak Positive
10.
Find the MAD for the following set: 85, 90, 68, 75, 79
a)
79.4
b)
6.48
c)
32.4
d)
79
11.
Find the MAD:
58, 38, 54, 48, 26, 36
58, 38, 54, 48, 26, 36
a)
43
b)
20
c)
10
d)
12
12.
Which of the following is the mean absolute deviation for the set of data?
2.50 3.75 1.25 2.25 3.00
2.50 3.75 1.25 2.25 3.00
a)
3.3
b)
0.66
c)
2.50
d)
2.55
13.
The prices at several different stores for a pair of shoes are shown below.
$78, $79, $81, $82, $83
Two days later, another store has the same shoes on sale for $65. How does the new price affect the data?
$78, $79, $81, $82, $83
Two days later, another store has the same shoes on sale for $65. How does the new price affect the data?
a)
Only the range was affected.
b)
The median increased, and the range increased.
c)
The mean increased, and the range increased.
d)
The mean decreased and the range increased.
14.
The data set below has an outlier of 42.
2, 5, 12, 15, 19, 4, 6, 11, 16, 18, 12, 12, 42
What effect does removing the outlier have on the distribution of the data?
2, 5, 12, 15, 19, 4, 6, 11, 16, 18, 12, 12, 42
What effect does removing the outlier have on the distribution of the data?
a)
The mean will decrease
b)
The median will decrease
c)
The mean will increase
d)
The median will increase
15.
Gabriella’s quiz grades are shown below.
88, 92, 92, 96, 98
Gabriella scored a 20 on her sixth quiz. What effect does this score have?
88, 92, 92, 96, 98
Gabriella scored a 20 on her sixth quiz. What effect does this score have?
a)
The low score causes the median to increase.
b)
The low score causes the median to decrease.
c)
The low score causes the mean to increase.
d)
The low score causes the mean to decrease.
100 %

