wayground logo

Free Printable Worksheets

NEW

Font size

S
M
L
XL
Worksheets

Chapter 8 Test - Part 2 (6th Grade)

Total questions: 60

Worksheet time: 4hrs 33mins

Name
Class
Date
1.
1. Find the average (mean) of these numbers.
10, 3, 2, 5
a)
5
b)
4
c)
10
d)
3
2.
What is the median?
a)
biggest- smallest
b)
average
c)
the middle #
d)
# that happens the most
3.
What is the median of this data set?
7.3, 2.9, 1.5, 0.6, 3.8
a)
2.9
b)
3
c)
3.5
d)
4.3
4.
When finding the median, what do you do if there are two middle numbers?
a)
Add them together and divide by 2
b)
Write them both as the answer
c)
Give up
d)
Pick one
5.
Find the median:
3, 5, 7, 4, 3, 1
a)
3 and 4
b)
There isn't one
c)
3.5
d)
3
6.
The science scores of nine students in a class are 72, 94, 56, 71, 88, 95, 59, 98 and 60. What is the median of the scores?
a)
72
b)
73
c)
56
d)
75.5
7.
Find the median of these numbers:
4,2,7,4,3
a)
2
b)
5
c)
7
d)
4
8.
In order to find the median, the data must be sorted from least to greatest first.
a)
True
b)
False
9.
What is the mean of these numbers?
4,5,5,2,3,3,2,8
a)
40
b)
24
c)
4
d)
256
10.

Find the median for the set of numbers:

23, 37, 11, 58, 13, 45

a)

30

b)

23

c)

37

d)

28

11.

Find the median for the set of numbers:

85, 42, 64, 71, 39, 56, 26

a)

71

b)

42

c)

56

d)

60

12.

Find the median for the set of numbers:

23, 37, 11, 58, 13, 45

a)

30

b)

23

c)

37

d)

28

13.
On the semester final, Joe scored 85, Jill scored 89, and Bill scored a 99.What was the average score for these students? _________
a)
91
b)
273
14.
What is the mean of these numbers?
4,5,5,2,3,3,2,8
a)
40
b)
24
c)
4
d)
256
15.
To find the average of a set of numbers, add up all the items and divide by...
a)
2
b)
The minimum
c)
The maximum
d)
The number of items
16.
What is the definition of the mean?
a)
The average
b)
The middle number
c)
The difference between the highest and lowest numbers
d)
The number that occurs the most
17.
The height of three basketball players is 210 cm, 220 cm and 191 cm.
What is their average height?
a)
210
b)
207
c)
220
d)
200
18.

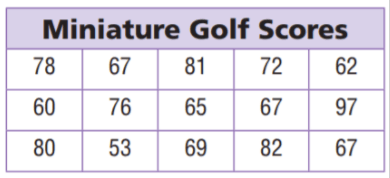
What is the range of miniature golf scores?

a)

44 points

b)

29 points

c)

33 points

d)

39 points

19.

Find the range of the data.

63, 71, 65, 66, 87, 53

a)

32

b)

33

c)

34

d)

35

20.

Find the range of the data.

16, 28, 6, 19, 21, 15, 22, 33, 17

a)

18

b)

27

c)

30

d)

12

21.
18, 4, 12, 2, 13, 18, 2, 2, 10
What is the range of this data set?
a)
9
b)
20
c)
2
d)
16
22.
93, 100, 82, 93, 67, 100, 67, 82, 93, 93
What is the range of this data set?
a)
26
b)
93
c)
33
d)
82
23.
What is the range?
a)
average
b)
biggest-smallest
c)
the middle #
d)
# happening the most
24.

A(n) ____ of a data set is much greater or much less than the other data values.

a)

mean

b)

median

c)

mode

d)

outlier

25.

Identify the outlier for the given data?

23, 34, 27, 7, 30, 26, 28, 31, 34

a)

7

b)

23

c)

31

d)

34

26.

Your math grades are 90, 85, 0, 90, 80, 100, and 90. Which grade is the outlier?

a)

90

b)

0

c)

80

d)

100

27.

What is the outlier in the following data?

11, 19, 17, 8, 37, 11, 19, 16, 22

a)

22

b)

8

c)

37

d)

22

28.

Which of the following numbers is the outlier?

34, 75, 82, 95, 100, 100

a)

75

b)

34

c)

95

d)

100

29.

Out of these seven numbers, which one is the minimum?


2, 2, 4, 7, 9, 16, 24

a)

2

b)

7

c)

16

d)

4

30.

Out of these seven numbers, which one is the maximum?


3, 6, 9, 12, 14, 14, 27

a)

3

b)

6

c)

14

d)

27

31.

Out of these eight numbers, which one is the minimum?


12, 3, 15, 83, 6, 7, 5, 0

a)

12

b)

0

c)

83

d)

3

32.

What is the range of these seven numbers?


3, 5, 7, 7, 7, 10, 12

a)

7

b)

5

c)

9

d)

10

33.

Out of the four cousins, Zach is 16, Dylan is 12, Shawn is 10, and Ryder is 4. What is the range of their ages?

a)

16

b)

12

c)

8

d)

2

34.
How many students scored more than 80%?
a)
10
b)
13
c)
7
d)
15
35.
How many students got a perfect score on the test?
a)
0
b)
2
c)
6
d)
1
36.
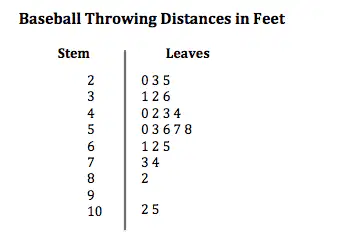
What is the difference between the shortest and the longest distance of the baseball thrown?
a)

10.05 feet

b)

85 feet

c)

82 feet

d)

80 feet

37.
How many games did the team play?
a)
15
b)
12
c)
24
d)
14
38.
In how many games did the team score more than 20 points?
a)
8
b)
7
c)
10
d)
9
39.
What is the minimum in this data set?
a)
0
b)
4
c)
9
d)
40
40.
What is the highest quiz grade in the stem and leaf plot?
a)
9
b)
26
c)
92
d)
96
41.

What is the Maximum data item on this plot?

a)

49

b)

58

c)

1036

d)

35

42.

What is the Minimum data item of this plot?

a)

0

b)

1

c)

72

d)

40

43.
How many students were greater than or equal to 60 inches tall?
a)
21
b)
11
c)
17
d)
6
44.
Which interval shows the greatest number of pets?
a)
15-19
b)
0-4
c)
5-9
d)
10-14
45.
How many cities have temperatures between 70 degrees and 99 degrees?
a)
44
b)
34
c)
26
d)
62
46.
21. How many students are represented by the histogram?  
a)
Cannot be determined
b)
9
c)
31
d)
35
47.
How many students scored between a 86 and a 90?
a)
1
b)
3
c)
6
d)
10
48.
How many students are between 60 and 63 inches tall?
a)
3
b)
0
c)
12
d)
7
49.
How many students are between 48 and 51 inches tall?
a)
14
b)
8
c)
2
d)
0
50.

How many people are between the ages of 80 and 90?

a)

-5

b)

0

c)

5

d)

10

51.

Is this a Histogram or a Dot Plot?

a)

Histogram

b)

Dot Plot

52.

Which age groups had 20 to 30 people who favor M&M s?

a)

Age 6-10

b)

Age 21-25

c)

Age 6-10 AND age 26-30

d)

All ages

53.

How many people between the ages 16 and 20 prefer M&Ms?

a)

48

b)

Over 50

c)

Under 30

d)

40

54.

How many people between the ages 0 and 10 prefer M&Ms?

a)

About 30

b)

About 5

c)

About 27

d)

About 45

55.

Which graph represents histogram?

a)
b)
c)
d)
56.
Elliot says almost everyone arrived at the party after 10:00 P.M., but Nancy thinks most people came earlier. When did a majority of the people arrive? 
a)
7:00-7:59 P.M.
b)
8:00–8:59 P.M.
c)
9:00–9:59 P.M.
d)
10:00–10:59 P.M. 
57.
Emily is making a histogram for the data 12, 24, 56, 7, 34, 75, 86, 78, and 96.  What is the most appropriate first interval? 
a)
0-5
b)
0-10
c)
0-50
d)
0-100
58.
Which interval shows the greatest number of pets?
a)
15-19
b)
0-4
c)
5-9
d)
10-14
59.

Which answer best fits the shape of the histogram?

a)

Symmetric

b)

Skewed Left

c)

Skewed Right

d)

Uniform

60.

Which histogram is double-peaked?

a)
b)
c)