wayground logo

Free Printable Worksheets

Font size

S
M
L
XL
Worksheets

Adv Chapter 11 Review Quizizz

Total questions: 80

Worksheet time: 3hrs 15mins

Name
Class
Date
1.
The number of miles that Jenna cycled each week for a 7-week period is shown: 
36, 42, 28, 52, 48, 36, 31 
What is the median number of miles Jenna cycled?
a)
24
b)
36
c)
39
d)
52
2.
The mode score on the 6th grade math test was 94! Which of these interpretations must be correct?
a)
94 was the highest score on the test.
b)
More students received a 94 than any other score
c)
No student scored below a 94
d)
A score of 91 was slightly below average.
3.
A  number that is either MUCH larger or MUCH smaller than the rest of the numbers is a(n)
a)
outlier
b)
inlier
c)
lier
d)
I'm lying
4.
If a number is added to the set that is near the mean, how does this affect standard deviation?
a)
increase
b)
decrease
c)
stay the same
d)
both increase and decrease
5.
If you have two numbers in the middle, you should
a)
add them together and divide by two
b)
find the number in between the two
c)
find the mean of the two numbers
d)
all of these
6.
If a number is added to the set that is in the middle of the data, how does this affect the range?
a)
increase
b)
decrease
c)
stay the same
d)
both increase and decrease
7.
If 10 is added to every value in a set of data, what will happen to the value of the median?
a)
it will increase by 10
b)
it will decrease by 10
c)
it will stay the same
d)
it will both increase and decrease
8.
Which of the following is a measure of variability?
a)
mean
b)
median
c)
mode
d)
standard deviation
9.
Given the set of data below, what would be the most meaningful measure?
1, 1, 1, 1, 1, 1, 1, 1, 1, 21
a)
Mean
b)
Median
c)
Mode
d)
Range
10.
The number of pages that Carolyn wrote in her journal each day from Monday to Friday is shown below: 
9, 8, 12, 6, 10
What is the mean number of pages she wrote per day?
a)
5
b)
6
c)
9
d)
11
11.
The Table above shows the points scored by the JV basketball team in their first seven games. Calculate the mean, median, mode and range. Which statistical measure makes the team sound the best?
a)
Mean
b)
Median
c)
Mode
d)
Range
12.
Which class has the higher test score median? 
a)
Class #1
b)
Class # 2 
c)
The medians are equal
d)
The median is not shown here. 
13.
Which class was more consistent in their Algebra Scores?
a)
Class #2
b)
Class #1
c)
Both classes had the same consistency.
d)
50%
14.
Paulo got these grades in three tests: 72, 80 and 82. He had one more test to take. He wanted an average of 80 for the four tests. What mark must he get in the fourth test?
a)
80
b)
234
c)
It is not possible for him to get an 80 average
d)
86
15.
Mrs. Rosenblatt's class has an average grade of 87. Later on she realizes she left out Joe's score. His grade was a 65. The new mean will ,....
a)
increase
b)
decrease
c)
stay the same
16.
Ms. Rork's class had a range of test grades from 78 to 97. She forgot to add in a student who got an 80% on the test. How will this affect the range?
a)
Increase
b)
Decrease
c)
Stay the Same
17.
You are given a list of numbers with a median of 10.  Each of the numbers is doubled.  What will happen to the median of the second set of numbers?
a)
It will increase by one-half
b)
It will double
c)
It will stay the same
d)
Not enough information is given
18.
The list below shows the number of words per minute students in Mrs. DeFelice's class typed last week:
42, 55 ,62, 39, 38, 70, 54, 56, 73.
Which would change the range from 35 to 38?
a)
A new student types 38 wpm
b)
The student that  typed 39 wpm moved
c)
A new student types 35 wpm
d)
The student that typed 73 wpm movedd
19.

What does the "Q" stand for in Q1, Q2, and Q3?

a)

Quadrants

b)

Quartiles

c)

Quarts

20.

Which one is the "median"?

a)

Q1

b)

Q2

c)

Q3

21.

TRUE OR FALSE:

The "upper quartile" is Q3

The "lower quartile" is Q1

a)

True

b)

False

22.

According to the box plot,

what is the MEDIAN?

a)

79

b)

85

c)

93

d)

70

e)

99

23.

What is the MINIMUM?

3, 5, 2, 6, 7, 3

a)

3

b)

2

c)

5

d)

7

24.

What is the MAXIMUM?

7, 3, 2, 5, 8, 4

a)

7

b)

2

c)

4

d)

8

25.

What are the MINIMUM and MAXIMUM values?

a)

3 and 18

b)

4 and 15

c)

10.5

d)

6 and 13

26.

To create your box plot,

you must find your

"___ number summary".

a)

complete

b)

three

c)

five

d)

quartile

27.
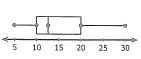
What percent of the data is between 25 and 30 on the number line?
a)
25%
b)
`50%
c)
75%
d)
100%
28.
11. What percentage of the data is between 90 and 140?
a)
25 %
b)
50%
c)
75%
d)
100%
29.
What is the interquartile range (IQR)?
a)
4
b)
64
c)
60
d)
8
30.
Which box and whisker plot has the highest median?
a)
Top plot
b)
Bottom plot
31.
What is the difference between Q3 and Q1?
a)
4
b)
8
c)
2
d)
6
32.
What percent does each of the 4 sections contain on a box and whisker plot?
Hint: Look at your notes!
a)
25%
b)
50%
c)
75%
d)
100%
33.
What percent of students have heights between 60 inches and 66 inches?
a)
75%
b)
50%
c)
100%
d)
25%
34.
What percentage of the data is between 40 and 150?
a)
25 %
b)
50%
c)
75%
d)
100%
35.
Which city has a higher median?
a)
Millersburg
b)
Arcadia
36.

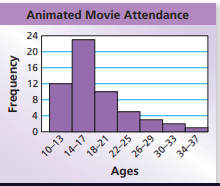
What is the shape of the data?

a)

symmetrical

b)

skewed left

c)

skewed right

d)

bell curve

37.

What is the shape of the data?

a)

symmetrical

b)

skewed left

c)

skewed right

d)

bell curve

38.
What is the shape of the data for Lucy's Steakhouse?
a)
Symmetrical
b)
Skewed Left
c)
Skewed Right
39.
Which of the following best describes the shape of the distribution?
a)
SKEWED LEFT
b)
SKEWED RIGHT
c)
UNIFORM
d)
SYMMETRICAL
40.
Which of the following best describes the shape of the distribution?
a)
SKEWED LEFT
b)
SKEWED RIGHT
c)
UNIFORM
d)
SYMMETRICAL
41.
Which of the following best describes the shape of the distribution?
a)
SKEWED LEFT
b)
SKEWED RIGHT
c)
UNIFORM 
d)
SYMMETRICAL
42.

How would you describe this data?

a)

Skewed Left

b)

Skewed Right

c)

Symmetrical

d)

A total amount

43.
What is the interquartile range (IQR) of the data set?
a)
20
b)
25
c)
5
d)
10
44.
Which of the following best describes the process of finding the interquartile range for a set of data?
a)
Add the biggest and smallest numbers.
b)
Place the numbers in order from least to greatest and find the middle.
c)
Find the difference between the maximum and the minimum.
d)
Subtract Q1 from Q3.
45.

What was the high score on the test?

a)

96

b)

100

c)

102

d)

88

46.

What percent of the class scored above a 72?

a)

50%

b)

75%

c)

25%

d)

28%

47.

What percent of the class scored between 88 & 96?

a)

8%

b)

25%

c)

50%

d)

88%

48.

What is the range of scores that the middle 50% of the students scored on the test?

a)

12

b)

64

c)

16

d)

24

49.

Which statement is true about the double box-and-whisker plot?

a)

The test scores in your friend's class are more spread out than the test scores in your class.

b)

Half of the test scores in your class are between 85 and 100.

c)

25% of the test scores in your friend's class are 80 or above.

d)

The medians are the same for both classes.

50.
According to the two-way table, a person who plays an instrument is most likely to:
a)
Not play an instrument
b)
Not play a team sport
c)
Play a team sport
d)
All of the above
51.
What percentage of males drive sports cars?
a)
35%
b)
16.25%
c)
65%
d)
25%
52.
According to the table, what is the relative frequency of students ages 10 - 13 who eat breakfast?
a)
About 33%
b)
About 50%
c)
About 40%
d)
About 44%
53.
Identify the join relative frequency of boys that have blond hair.
a)
.4
b)
0.1
c)
0.44
d)
0.2
54.
What type of data are jersey numbers?
a)
Quantatative
b)
Categorical
55.

Your teacher asked "What percentage of girls have blonde hair?"


What type of relative frequency is the teacher asking for?

a)

Conditional Relative Frequency

b)

Joint Relative Frequency

c)

Marginal Relative Frequency

56.

Your teacher asked "What percentage of the students have brown hair?"


What type of relative frequency is the teacher asking for?

a)

Conditional Relative Frequency

b)

Joint Relative Frequency

c)

Marginal Relative Frequency

57.

For just those who cannot bike to school, what is the relative frequency (to the nearest percent) of boys?

a)

4%

b)

14%

c)

13%

d)

29%

58.

Which of these values below is a marginal frequency?

a)

182

b)

120

c)

46

d)

10

59.

The ratio of a joint relative frequency to a related marginal relative frequency in a two-way table.

a)

Conditional Relative Frequency

b)

Joint Relative Frequency

c)

Marginal Relative Frequency

d)

Relative Frequency

60.

Which of the values below is a joint frequency?

a)

400

b)

200

c)

182

d)

4

61.

The number of people who purchased a hot dog and a soda is an example of ___________.

a)

Marginal Frequency

b)

Joint Frequency

c)

Marginal Relative Frequency

d)

Joint Relative Frequency

e)

Conditional Relative Frequency

62.

Of the 400 people who purchased concessions, 50% of them bought a soda. This is an example of

a)

Joint Frequency

b)

Marginal Frequency

c)

Joint Relative Frequency

d)

Marginal Relative Frequency

e)

Conditional Relative Frequency

63.

Of the 200 people who bought soda, 25% of them also bought a hot dog. This is an example of_________.

a)

Joint Frequency

b)

Marginal Frequency

c)

Joint Relative Frequency

d)

Marginal Relative Frequency

e)

Conditional Relative Frequency

64.

48 male and 52 female students take a survey about their preferred sport. According to the chart, which sport was most popular among female students?

a)

Baseball

b)

Basketball

c)

Football

d)

Golf

65.

The flower is 8 cm tall.

a)

qualitative data

b)

quantitative data

66.

The center of the flower is yellow and fuzzy.

a)

qualitative data

b)

quantitative data

67.
Explain why this graph may be misleading?
a)
the x-axis does not have equal intervals
b)
San Fransisco is not a real city
c)
you cannot have percents in a line graph
d)
the y-axis does not have equal intervals
68.

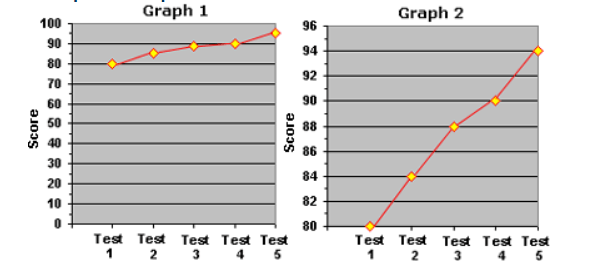
Alden wanted to impress his parents by showing the rapid increase in his score on 5 tests. Which graph should he use to impress them?

a)

Graph 1

b)

Graph 2

c)

Neither

d)

Both

69.

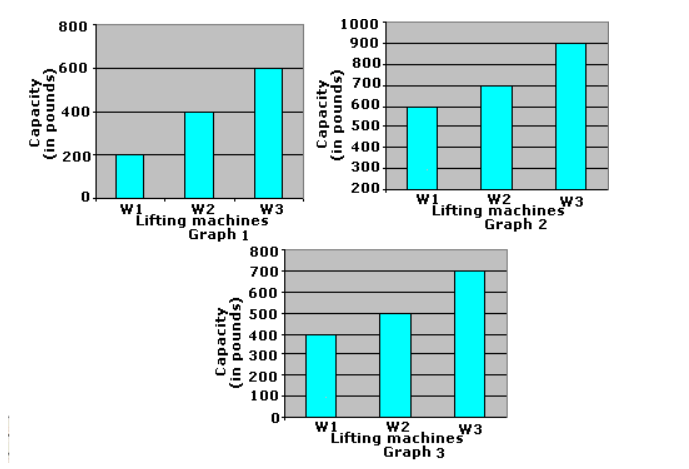
Which graph is misleading?

a)

graph 1

b)

graph 2

c)

graph 3

d)

graph 2 and 3

70.
Which graph is misleading?
a)
Neither graph is misleading.
b)
The graph on the left is misleading because the y-axis does not start at zero.
c)
The graph on the right is misleading because the difference should be more than what the graph shows.
71.

Which graph is best display of data?

a)

Bar Graph

b)

Line Graph

c)

Histogram

d)

Pie Chart

72.

Which statement below is the correct answer for the difference between bar graph and histogram?

a)

Bar graph and Histogram is actually same

b)

Histogram is better than bar graph to show discrete data

c)

Histogram groups numbers into ranges, but bar graph doesn't

d)

all statements above are true

73.
Your teacher has asked you to explain the difference between quantitative and qualitative observations. Which statement is correct?
a)
Quantitative observations use numbers, qualitative uses the senses.
b)
Quantitative observations use the senses, qualitative uses numbers.
c)
Quantitative observations use measurement, qualitative uses numbers.
d)
Quantitative observations use colors, qualitative uses the senses.
74.
The leaves on the plant are turning brown.
a)
Qualitative
b)
Quantitative
c)
Both
d)
Neither
75.
There are 16 red marbles in the bag.
a)
Qualitative
b)
Quantitative
c)
Both
d)
Neither
76.
The pendulum made 17 full swings in 30 seconds.
a)
Qualitative
b)
Quantitative
c)
Both
d)
Neither
77.
There are 16 red marbles in the bag.
a)
Qualitative
b)
Quantitative
c)
Both
d)
Neither
78.
The pendulum made 17 full swings in 30 seconds.
a)
Qualitative
b)
Quantitative
c)
Both
d)
Neither
79.
What percentage of males drive sports cars?
a)
35%
b)
16.25%
c)
65%
d)
25%
80.
What percentage of the days that it rained, did they forecast no rain?
a)
About 20%
b)
About 18%
c)
About 14%
d)
About 12%