wayground logo

Free Printable Worksheets

Font size

S
M
L
XL
Worksheets

Unit 12 Test Review

Total questions: 110

Worksheet time: 9hrs 10mins

Name
Class
Date
1.
Which interval has 400 employees?
a)
33-43
b)
0-10
c)
77-87
d)
66-76
2.
How many students were greater than or equal to 60 inches tall?
a)
21
b)
11
c)
17
d)
6
3.

What percentage of students are between 60 and 63 inches tall?

a)

25.9%

b)

60%

c)

14.9%

d)

7%

4.
What percent of people drink 4-7 cups of coffee per week?
a)
44.4%
b)
11.1%
c)
3%
d)
16.7%
5.
How many people watched more than 6 hours of TV?
a)
10
b)
5
c)
20
d)
17
6.
Which interval has 400 employees?
a)
33-43
b)
0-10
c)
77-87
d)
66-76
7.
How many students were greater than or equal to 60 inches tall?
a)
21
b)
11
c)
17
d)
6
8.

What percentage of students are between 60 and 63 inches tall?

a)

25.9%

b)

60%

c)

14.9%

d)

7%

9.
What percent of people drink 4-7 cups of coffee per week?
a)
44.4%
b)
11.1%
c)
3%
d)
16.7%
10.
How many people watched more than 6 hours of TV?
a)
10
b)
5
c)
20
d)
17
11.
What is an interval?
a)
A single number
b)
A range of numbers
c)
A percentage
d)
A total amount
12.
Which interval shows the greatest number of pets?
a)
15-19
b)
0-4
c)
5-9
d)
10-14
13.
21. How many students are represented by the histogram?  
a)
Cannot be determined
b)
9
c)
31
d)
35
14.
What was the exact price most people payed for a gallon of gas?
a)
$2.10
b)
$1.95
c)
$2.03
d)
We can not tell using the histogram
15.

How many trees are at least 15 feet tall?

a)

12 trees

b)

2 trees

c)

9 trees

d)

41 trees

16.

The height of the students in Mrs. Abel's class were recorded. Which line plot represents the same data shown in the histogram?

a)
b)
c)
d)
17.
Raul measured the heights of the apple trees in an orchard.
What percent of the trees are 5-9 feet tall?
a)
18.9%
b)
31%
c)
22.1%
d)
10%
18.
Charlene made a line plot to graph the ages of employees in an outdoor advertising company Suppose Charlene wants to display this data in a histogram with the bars labeled in the following ages: 20–24, 25–29, 30–34, and 35–39. How tall will the 25–29 bar be? 
a)
10
b)
11
c)
12
d)
14
19.
The height of all the students in Ms. Long's class are recorded in the table. Where would the median fall?
a)
60-65
b)
50-54
c)
40-44
d)
55-59
20.
What percent of students have less than 1,000 songs on their MP3 players?
a)
15%
b)
80%
c)
20%
d)
45%
21.
How many people watched more than 25 hours of TV last week?
a)
0
b)
10
c)
38
d)
42
22.

In which interval would the median fall?

a)

70-79

b)

80-89

c)

90-99

23.
Each dot represents 1 day. How many days were recorded?
a)
9
b)
21
c)
20
d)
105
24.
What is the median of the data?
a)
105
b)
106
c)
104
d)
110
25.

What is the range of the data set?

a)

0.8

b)

8

c)

80

d)

.08

26.
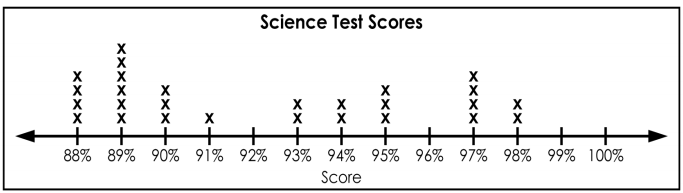
What is the mode?
a)
88%
b)
89%
c)
97%
d)
91%
27.

What is the mode for this data set? Remember the mode is the most common or most frequent data.

a)

55

b)

60

c)

70

d)

75

28.

What is the range for this data set? Remember to subtract the minimum value from the maximum value.

a)

10

b)

15

c)

25

d)

30

29.

What is the median for this data set? Remember to rank the data in order from least to greatest, then find the median, which is the middle number in the ranked set of data.

a)

55

b)

60

c)

70

d)

75

30.

What is the mean (average) for this data set? Remember to add all of the data then divide by the total number of data collected.

a)

60

b)

62

c)

64

d)

66

31.

What is the maximum value for this data set?

a)

90

b)

96

c)

102

d)

108

32.

What is the minimum value for this data set?

a)

78

b)

72

c)

66

d)

60

33.

What is the median for this data set? Remember to rank the data in order from least to greatest, then find the median, which is the middle number in the ranked set of data.

a)

22.5

b)

30

c)

37.5

d)

45

34.

How many students have a shoe size bigger than 8?

a)

2

b)

3

c)

4

d)

9

35.

What was the most number of books read?

a)

1

b)

6

c)

9

d)

12

36.

How many people were surveyed?

a)

4

b)

10

c)

15

d)

5

37.
How many more students scored a 98 than scored a 88?
a)
4
b)
2
c)
6
d)
35
38.
a)

3

b)

2

c)

4

d)

1

39.
What is the difference between the medians?
a)
16
b)
12
c)
8
d)
4
40.

About what percent of the students read at least 55 minutes?

a)

40%

b)

30%

c)

6%

d)

25%

41.

What is the ratio of the number of students who read less than 50 minutes to the number of students who read more than 50 minutes?

a)

6/5

b)

5/6

c)

3/2

d)

2/3

42.

What percent of the students have exactly 3 siblings?

a)

30%

b)

15%

c)

25%

d)

20%

43.

What percent of the students got 17 or more quiz answers correct?

a)

50%

b)

60%

c)

30%

d)

40%

44.

What percent of the students got 15 questions correct?

a)

30%

b)

26.6%

c)

20%

d)

25%

45.
Is the following question statistical or non statistical?
How many cars are in the parking lot?
a)
Statsitical
b)
Non Statistical
46.
Is the following question statistical or non statistical?
What pets do students in our class have?
a)
Statistical
b)
Non statistical
47.
Is the following question statistical or non statistical?
How many ceiling tiles are in our classroom?
a)
Statistical
b)
Non Statistical
48.
Is the following question statistical or non statistical?
How tall are the students in our class?
a)
Statistical
b)
Non Statistical
49.
How many times have I watched Star Wars?
a)
Statistical Q
b)
Non Statistical Q
50.
What time does school get out today?
a)
Statistical Q
b)
Non Statistical Q
51.
How many minutes do 6th grade students typically spend on homework each week?
a)
Statistical Q 
b)
Non Statistical Q
52.
How many words are there in this sentence?
a)
Statistical Q
b)
Non-Statistical Q
53.

What is a requirement of a statistical question?

a)

one set answer

b)

a variety of answers

54.

Choose the statistical question:

a)

How many sixth graders ate breakfast on Monday?

b)

How many sixth graders eat breakfast each school day?

55.

Choose the statistical question:

a)

What time did you wake up this morning?

b)

What time do sixth graders wake up each morning during the school week?

56.

What is the main purpose for asking statistical questions?

a)

Surveying people is fun.

b)

We can create charts with statistics.

c)

Statistical questions help us gather data about a topic.

57.

Statistical questions have _____ possible answers.

a)

zero

b)

one

c)

only two

d)

two or more

58.

Statistical questions should ALWAYS...

a)

provide helpful information for someone (be relevant)

b)

be meant for kids to answer

c)

be asked of adults, not kids

d)

have one right answer

59.

Is the following question statistical or non-statistical?

You ask people in an airport, "How many states have you visited?"

a)

Statistical Question

b)

Non-Statistical question

60.
Is the following question statistical or non statistical?
How many music videos has Taylor Swift made?
a)
Statistical
b)
Non-Statistical 
61.

How much does my pet cat weigh?

a)

Non-Statistical because it is talking about only YOUR cat.

b)

This is a statistical question because you are talking about more than one cat

62.

How many cats does Ms. Beyman own?

a)

statistical

b)

non-statistical

63.
Roger bowled 7 games last weekend. His scores are: 155, 165, 138, 172, 127, 193, 142. What is Roger's median score?
a)
127
b)
155
c)
156
d)
193
64.
33, 25, 42, 25, 31, 37, 46, 29, 38
What is the third quartile of the data?
a)
37
b)
38
c)
40
d)
46
65.
33, 25, 42, 25, 31, 37, 46, 29, 38
What is the interquartile range of the data?
a)
8
b)
9
c)
13
d)
21
66.
Identify the outlier for the given data?
23, 34, 27, 7, 30, 26, 28, 31, 34
a)
7
b)
23
c)
31
d)
34
67.
What is the median of the data?
a)
200
b)
100
c)
90
d)
140
68.
Which city has a minimum value that is lower?

a)
Millersburg
b)
Arcandia
69.
Which of the following best describes the process of finding the interquartile range for a set of data?
a)
ADD the biggest and smallest numbers
b)
Place the number in order from least to greatest then find the middle.
c)
Find the difference between the Maximum and the Minimum.
d)
Subtract Q3 from Q1
70.
You must find the 5 number summary in order to make a box and whisker plot. 
a)
True
b)
False
71.
Which of the following lists all parts of the five number summary?
a)
Mean, Median, Mode, Range, and Total
b)
Minimum, Quartile 1, Median, Quartile 3, and Maximum 
c)
Smallest, Q1, Q2, Q3, and Q4
d)
Minimum, Maximum, Range, Mean, and Median
72.
What is Millersburg's Q3 value?
a)
200
b)
260
c)
220
d)
140
73.
What percentage of the data is between 90 and 140?
a)
25 %
b)
50%
c)
75%
d)
100%
74.
What percentage of the data is between 90 and 140?
a)
25 %
b)
50%
c)
75%
d)
100%
75.
What percentage of the data is between 40 and 150?
a)
25 %
b)
50%
c)
75%
d)
100%
76.
What percentage of the data is between 40 and 90?
a)
25 %
b)
50%
c)
75%
d)
100%
77.
What percent does each of the 4 sections contain on a box and whisker plot?
a)
100%
b)
75%
c)
50%
d)
25%
78.
What is the term for the median of the lower half of the data?
a)
Lower Quartile
b)
Upper Quartile
c)
Median
d)
Maximum
79.
What is the term for the median of the upper half of the data?
a)
Upper Quartile
b)
Lower Quartile
c)
Median
d)
Minimum
80.
What is the term that means the middle data value?
a)
Mean
b)
Median
c)
Mode
d)
Range
81.
Which car club has the higher median?
a)
Cruisers
b)
Car Hops
82.
What is the IQR of the Cruisers?
a)
4
b)
6
83.
What is the IQR of the Car Hops?
a)
4
b)
6
84.
What is the difference in the IQRs?
a)
1
b)
2
c)
3
d)
4
85.
What is the range of the Cruisers?
a)
9
b)
13
86.
50% of the Cruisers attended between 7 and 16 car shows.  True or False?
a)
True
b)
False
87.
50% of the Car Hops went to 11 or fewer car shows.  True or False?
a)
True
b)
False
88.
What is the minimum number of shows attended by a car club?
a)
0
b)
3
c)
7
89.
Find the fifth number in this set so that the mean is 4.       3, 9, 2, 1, x
a)
3
b)
0
c)
7
d)
5
90.
Which number is not the mean, median, mode, or range of the data set:
4, 3, 15, 11, 3, 8, 7, 5?
a)
3
b)
6
c)
12
d)
11
91.
The mean of five numbers is 26. The first four numbers are 10, 20, 30, and 20. Find the 5th number.
a)
130
b)
80
c)
50
d)
20
92.
The mean of 6 numbers is 5.5.  The first five numbers are 2, 5, 6 , 7, 8.  Find the sixth number.
a)
33
b)
28
c)
5.5
d)
5
93.

Dr. Dre is a dentist. He needs to report on the mean number of cavities that his patients have.

1, 0, 1, 5, 6, 3, 4

a)

3.33

b)

2.85

c)

3

d)

3.5

94.

At Donald's Donuts, the number of donut holes in a bag can vary. Help Donald find the mode.

12,10,10,10,13,12,11,13,10

a)

13

b)

12

c)

11

d)

10

95.

Roger bowled 7 games last weekend. His scores were: 155, 165, 138, 172, 127, 193, 142. What is the range of Roger's scores?

a)

193

b)

127

c)

60

d)

66

96.

What is mode?

a)

number happening the most

b)

the average

c)

biggest - smallest

d)

the middle number

97.

Find the mean of these numbers:

5, 11, 2,12, 4, 2

a)

4.1

b)

6

c)

4.5

d)

4

98.

Find the median of these numbers:

4, 2, 7, 4, 3

a)

2

b)

5

c)

7

d)

4

99.

Find the mean of these numbers:

2, 57, 38, 42, 6

a)

29

b)

38

c)

50

d)

145

100.
Identify the outlier for the given data?
23, 34, 27, 7, 30, 26, 28, 31, 34
a)
7
b)
23
c)
31
d)
34
101.

What is the mean?

a)

number happening the most

b)

the number in the middle

c)

biggest-smallest

d)

the average

102.
A data set can have more than one median?
a)
True
b)
False
103.

Find the median, mode, and range:

3, 5, 7, 9, 11, 8, 3

a)

median:3 mode:7 range:8

b)

median:6 mode:3 range:7

c)

median:7 mode:3 range:8

104.

If there is an even number of data in the data set, how do you find the median?

a)

order the data and find the middle value

b)

order the data, add the 2 middle values and divide by 2

105.
The mode score on the 6th grade math test was 94! Which of these interpretations must be correct?
a)
99 was the highest score on the test.
b)
More students received a 94 than any other score
c)
No student scored below a 50
d)
A score of 91 was slightly below average.
106.
To find the ______ you put all numbers in order from least to greatest and then take the largest number minus the smallest number.
a)
Mean
b)
Median
c)
Mode
d)
Range
107.
To find the ______ you put all the numbers in order from least to greatest and then see which number you have the most of.
a)
Mean
b)
Median
c)
Mode
d)
Range
108.
To find the ________ you put all numbers in order from least to greatest and find the number that is in the middle.
a)
Mean
b)
Median
c)
Mode
d)
Range
109.
The number of miles that Jenna cycled each week for a 7-week period is shown: 
36, 42, 28, 52, 48, 36, 31 
What is the median number of miles Jenna cycled?
a)
24
b)
36
c)
39
d)
52
110.
The number of miles that Jenna cycled each week for a 7-week period is shown: 
36, 42, 28, 52, 48, 36, 31 
What is the mean number of miles Jenna cycled?

a)
31
b)
36
c)
39
d)
41