
 Worksheets
Data and Statistics Review
Total questions: 30
Worksheet time: 2hrs 30mins
Is the following question statistical or non statistical?
How many cars are in the parking lot?
Statistical
Non Statistical
Is the following question statistical or non statistical?
How many siblings does each student have?
Statistical
Non Statistical
Is the following question statistical or non statistical?
How tall are the students in our class?
Statistical
Non Statistical
Is the following questions statistical or non statistical?
How many minutes do 6th grade students typically spend on homework each week?
Statistical
Non Statistical
What type of data are we collecting when asking: "How many pets do you have?"
Categorical Data
Numerical Data
What type of data are we collecting when asking: "How much does your backpack weigh?"
Categorical Data
Numerical Data
What type of data are we collecting when asking: "Where were you born?"
Categorical Data
Numerical Data
What is the range?
The sum of the largest and smallest number
The number in the middle
The difference between the largest and smallest number
The number that appears most often
What is the median?
The number in the middle when the numbers are in order from least to greatest.
The difference between the largest and smallest number.
The average
The number that appears most often.
9, 8, 12, 6, 10
What is the mean number of pages she wrote per day?
36, 42, 28, 52, 48, 36, 31
What is the median number of miles Jenna cycled?
5, 15, 10, 20, 15, 10, 15
67, 74, 95, 98, 98, 99, 102
What is the median of this data set?
3 , 17 , 17 , 11 , 8 , 13 , 5 , 18
11
12
13
17
Calculate the mean of Shelly's test scores if she has scored 75, 97, and 92 so far this semester.
92
88
132
123

What is the mode of the data?
74
82
80
83

How many students are in the class?
25
19
10
1

Ms. Moss did a survey of her class about how many books they read over the summer. Using the dot plot, identify the correct statements.
More of her students have read more than 4 books than the number of students who read less than 3 books.
Ms. Moss surveyed 20 students.
Half of the students have read more than 1 book.
Most of the students have read at least 1 book.

A line plot shows the distance (in miles) that several students walked during gym class.
Choose all statements that are TRUE about the data.
Most of the students walked less than 1 1/4 miles.
The most common distance walked was 1 1/2 miles.
None of the students walked exactly 1 3/8 miles.
The longest distance walked was 1 1/8 miles farther than the shortest distance walked.


Which is the most popular pet?
Dog
Cat
Hamster
Rabbit
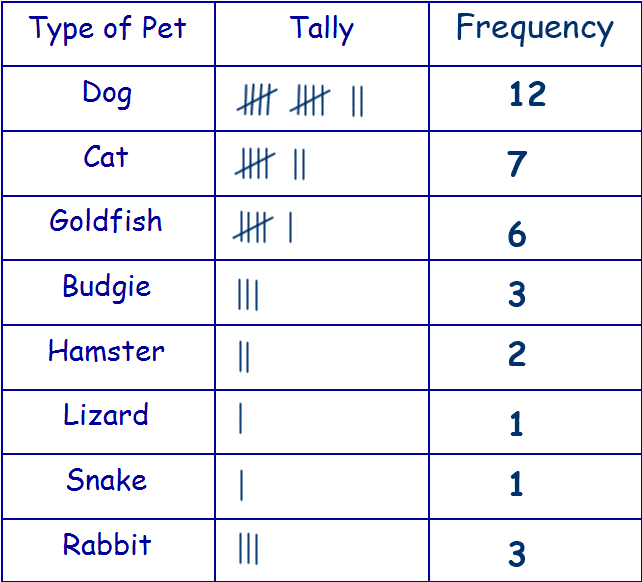
Which pet was chosen by 6 people?
Cat
Goldfish
Hamster
Snake

How many people like dogs and cats?
19
13
18
9

How many more people liked goldfish than snakes?
6
3
5
4

