
NEW
Font size
 Worksheets
EofY Exam Yr 8
Total questions: 45
Worksheet time: 13mins
The average, year-after-year conditions of temperature, precipitation, winds, and clouds in an area:
Tropical Zone
Climate
El Niño
La Niña
Cold periods in Earth's history during when glaciers covered large parts of the surface:
Sunspots
Ice Age
La Niña
Global Warming
Increased solar activity that causes Earth's temperature to rise:
Ice Age
Monsoon
Sunspots
Leeward
A gradual increase in the average temperature of Earth's atmosphere:
Global Warming
Greenhouse Gas
El Niño
Climate
Gases in the atmosphere that trap heat; carbon dioxide (CO2) is a major one:
Greenhouse Gas
Global Warming
Sunspot
CFCs

These graphs show increases in greenhouse
gasses in Earth’s atmosphere. As levels of
greenhouse gasses have increased, the
temperature of Earth’s surface has risen.
Which change has most likely contributed to a
rise in surface temperatures on Earth?
The world birth rate dropped to less than 22
births per 1,000 people per year.
The president of the United States signed a law
that created one of the country’s largest nature
parks.
Farmers increasingly use chemical fertilizers
that allow nitrogen and phosphorous to enter
water sources.
Humans began using work-saving technologies
that release carbon dioxide and methane.

The graph shows the increase in atmospheric
carbon dioxide concentration over several
decades.
Increasing carbon dioxide levels will directly affect
Earth's....
magnetic and gravitational fields.
weather and climate systems.
mantle convection.
rotation speed.

The graph shows changes in carbon dioxide
(CO2) concentrations and surface temperatures
on Earth from the years 1880 to 2000.
Why do carbon dioxide concentrations and
surface temperatures show the relationship seen
in the graph?
because lower carbon dioxide levels mean more
heat is retained in Earth's atmosphere
because higher carbon dioxide levels mean
more heat is retained in Earth's atmosphere
because lower carbon dioxide levels mean less
heat is retained in Earth's atmosphere
because higher carbon dioxide levels mean less
heat is retained in Earth's atmosphere

The graph shows changes in the levels ofatmospheric carbon dioxide over time. What might be one way to reverse the trend shown in the graph?
Increase the rate of deforestation.
Increase the rate of respiration.
Use more fossil fuels.
Plant more trees.
What is the greenhouse effect?
the effect of the Sun's radiation on the
chlorophyll in plant cells
the economic effect of climate change on the
United States' government
the increase of Earth's temperature due to heat
energy being trapped by certain atmospheric
molecules
the decrease in the temperature of Earth's
ocean currents due to atmospheric gases
blocking the Sun's radiation
How is the atmosphere involved in the
greenhouse effect?
Gases in the atmosphere trap and redirect heat
reflected from the surface of Earth.
Heat from the surface of Earth is absorbed by
gases and radiated into space.
Gases magnify the heat of the Sun as it passes
down through Earth's atmosphere.
It transforms light energy from the Sun into
thermal energy that warms the surface of Earth.
Which of the following adds to global warming by
decreasing the amount of carbon dioxide
removed from the atmosphere?
industrialization
burning fossil fuels
deforestation
polluting the oceans
The average number of people per square mile is...
Birth rate
Land area
Population density
too many
Most of the world's population lives in...
North America
Europe
Africa
Asia

This population pyramid shows...
Rapid growth
Slow growth
Negative growth

This population pyramid shows...
Rapid growth
Slow growth
Negative growth
Countries with a rapidly growing population are..
Developed
Developing
All of the following are characteristics of a developing countries EXCEPT...
A large rural population
A low life expectancy
Lack of access to education
Advanced technology
A country with slow or negative growth is usually...
Developed
Developing


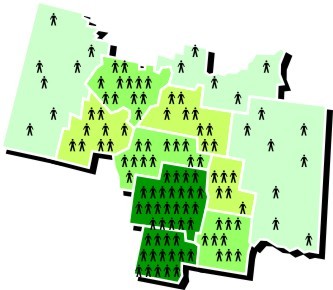
The average number of people per square kilometre


A sparse population means...
The population is generally very spread out with few people in an area
The population is generally very condensed and crowded
The population is very large
Population distribution means...
How many people there are
How people are spread out
How people travel around
The opposite of a sparse population is known as...
A packed population
An empty population
A dense population

Does this photo show a dense or sparse population?
Dense
Sparse

Does this photo show a population that is dense or sparse?
Dense
Sparse

Does this photo show a dense or sparse population?
Dense
Sparse

Which part of the world is more densely populated?
Oceania
Asia

Which part of the world is more sparsely populated?
Europe
North America

India is densely populated.
True
False

Canada is densely populated.
True
False

The population in Russia is evenly distributed.
True
False

Near a river population density would be...
high
low

Population density in a desert would be...
high
low
stable

In rugged mountains the population density could best be described as...
sparse
dense
When was the Berlin Conference?
1784-1785
1884-1885
1900-1901
1950-1951
Which of the following factors is NOT included in the calculation of the Human Development Index?
Life expectancy at birth
Educational attainment
Gross National Income per capita
Military expenditure
Which of the following is a common characteristic of slums?
High levels of sanitation and hygiene
Adequate housing and infrastructure
Overcrowding and inadequate access to basic services
Low population density
Which of the following best describes a positive correlation on a scatter plot graph?
As one variable increases, the other variable decreases.
As one variable increases, the other variable also increases.
As one variable increases, the other variable remains constant.
There is no discernible pattern between the variables.
What is the opposite of a positive correlation?
No correlation
Random correlation
Negative Correlation
Weak correlation
Which of the following is NOT a reason for a large development gap between our richest and poorest countries
Limited access to raw materials
Extreme climate
Dense population
Political instability

