
 Worksheets
Cartogram Set 1
Total questions: 90
Worksheet time: 2hrs 47mins
Which one of the following methods is the best suited to show the distribution of population with rural component and urban centre of verying sizes in a region?
Uniform Dot Method
Multiple Dot Method
Uniform Dot and Circle Method
Dot and Sphere Method
Population Density is usually shown by-
Isopleth method
Choropleth Method
Chorochromatic Method
Decimetric Method
A map of R. F. 1/2500 is enlarged by two-and-a-half times, what will be the scale of the enlarged map?
1/6250
1/1000
1/10000
1/12500
Ajai ranks seventeenth in a class of thirty one. What is his rank from the last?
13
14
15
16
Which of the following is not a Qualitative Distribution Map?
Choroschematic Map
Isopleth Map
Dot Map
Choropleth Map
Occupational structure of population in India at State Level is best represented by-
Dot Method
Isopleth
Choropleth
Pie Diagram
Which of the following map scales is a large scale?
1:250000
1:25000
1:500000
1:50000
An original map has the RF- 1:50000 and RF of the new map will be 1:250000. What is the correct proportion of enlargement/reduction as given below?
Reduction 1/5
Enlargement (5 times)
Reduction 1/10
Enlargement (10 times)
Flow maps are used to show the distribution of which type of following data?
Line
Area
Point
Volume
Which of the following diagram is used to show proportion of different land uses in an area?
Pie
Wind rose
Line
Flow-Chart
Match List I with List II and select a correct answer using the codes given below-
List I (Instruments)
(a) GPS base
(b) Pantograph
(c) Planimeter
(d) Stereoscope
LIst II (Functions)
1. Distance and area
2. 3-D Vision
3. Global Location
4. Reduction and Enlargement
Codes:
(A) a-3, b-1, c-4, d-2
(B) a-2, b-4, c-3, d-1
(C) a-3, b-4, c-1, d-2
(D) a-1, b-2, c-3, d-4
A
B
C
D
Match List I with List II and select a correct answer using the codes given below-
List I (Statistic)
(a) Standard Distance
(b) Nearest Neighbour
(c) Correlation
(d) Eigen Value
List II (Analysis)
1. Principal Component
2. Scatter Diagram
3. Settlement Pattern
4. Centrographic Measure
Codes:
(A) a-3, b-4, c-1, d-2
(B) a-4, b-3, c-2, d-1
(C) a-1, b-4, c-3, d-2
(D) a-2, b-3, c-4, d-1
A
B
C
D
Match List I with List II and select a correct answer using the codes given below-
List I (Name of Administrative Unit)
(a) District
(b) Department
(c) Country
(d) Kreise
LIst II (Name of the Country)
1. France
2. India
3. Germany
4. Great Britain
Codes:
(A) a-1, b-2, c-3, d-4
(B) a-4, b-2, c-3, d-1
(C) a-2, b-1, c-4, d-3
(D) a-3, b-2, c-1, d-4
A
B
C
D
Which one of the following diagrams is most suitable for depicting the distribution of urban land-use types of spatially spread urban centers?
Histogram
Sphere
Bar
Pie
A map with the scale of 1:50000 is enlarged to 5- times which one of the following scales is correct for the enlarged map?
1:250000
1:100000
1:10000
1:2500
Which of the following thematic maps is combined with complex themes? Select the correct combination of complex-thematic map from the codes given below-
1. Soil spread
2. Forest cover
3. Crop combination
4. Rainfal potential
1 and 2
2 and 3
3 and 4
2 and 4
Which one of the following number of parallels with one degree interval can be drwan between the poles on a globe?
180
178
179
181
Which one of the following symbols does not represents a point data?
Spot Heights
Bench Marks
Contours
Triangulation Stations
Which one of the following cartographic techniques is suitable for measureing spatial association among different attributes of the regional economy?
Bar diagram
Pie diagram
Choropleth
Isopleth
Match List I with List II and select a correct answer using the codes given below-
List I (Method)
(a) Isopleth
(b) Dot Maps
(c) Scatter Diagram
(d) Star Diagrams
LIst II (Uses)
1. Natural groupings
2. Distribution of population
3. Wind direction
4. Changes which are relatively gradual
Codes:
(A) a-4, b-2, c-3, d-1
(B) a-2, b-4, c-3, d-1
(C) a-4, b-2, c-1, d-3
(D) a-2, b-4, c-1, d-3
A
B
C
D
Which one of the following is shown with the help of Isobaths?
Salinity of sea water
Depth of ocean water
Altitude of oceanic water
Amplitude of wave
Which one of the following data can be represented by means of choropleth map?
Location Specific
Point Specific
Area Specific
Line Specific
Match List I with List II and select a correct answer using the codes given below-
List I (Aspect)
(a) Rural and Urban Population
(b) Population Density
(c) Relative Relief
(d) Decadal Population Growth
LIst II (Diagram)
1. Comparative Bars
2. Isolines
3. Dots and Spheres
4. Choropleth
Codes:
(A) a-1, b-2, c-3, d-4
(B) a-4, b-2, c-3, d-1
(C) a-2, b-1, c-4, d-3
(D) a-3, b-4, c-2, d-1
A
B
C
D
Which of the following diagrams are called Pie-diagrams?
Pictorial diagrams
Circle and sector diagrams
Ring Diagrams
Sphere Diagrams
Match List I with List II and select a correct answer using the codes given below-
List I (R.F)
(a) 1:2,50,000
(b) 1:50,00,000
(c) 1:25,000
(d) 1:4,000
LIst II (Level of Scale)
1. Cadastral
2. Large
3. Medium
4. Small
Codes:
(A) a-1, b-2, c-3, d-4
(B) a-4, b-2, c-3, d-1
(C) a-2, b-1, c-4, d-3
(D) a-3, b-4, c-2, d-1
A
B
C
D
Which one of the following areal extent is represented by an area bounded by a square of 3cm Χ 3cm on a 1:50,000 scale topographical sheet?
900 sq km
1.00 sq km
3.20 sq km
2.25 sq km
Which one of the following diagrams can be used to represent non-spatial attribute data?
Flow Line
Bars and Cubes
Choropleth
Isolines
Given below are two statements, one labeled as Assertion (A) and the other labeled as Reason (R). Select your answer from the code given below: Assertion (A) : Maps that are usually refering various attributes, information are called complex Thematic maps.
Reason (R): Complex Thematic Maps are used to show locations of earth's different features and activities.
Codes:
A) Both (A) and (R) are true and (R) is the correct explanation of (A).
B) Both (A) and (R) are true, but (R) is not a correct explanation of (A).
C) (A) is true, but (R) is false.
D) (A) is false, but (R) is true.
A
B
C
D
Match List I with List II and select a correct answer using the codes given below-
List I (Land Use/Land Cover Types)
(a) Forests
(b) Cultivated area
(c) Uncultivated areas
(d) Built up areas
LIst II (Conventional Colour Map Symbols)
1. Yellow
2. Red
3. Dark Green
4. Brown
Codes:
(A) a-3, b-1, c-4, d-2
(B) a-4, b-2, c-3, d-1
(C) a-2, b-1, c-4, d-3
(D) a-3, b-4, c-2, d-1
A
B
C
D
Which of the following is a non-qualitative areal distribution map?
Choropleth
Isopleth
Multiple Dots
Choroschematic
Consider the following line symbols-
(a) Isobars
(b) Contours
(c) Hachures
(d) Isochrones
Which of the above depicts relief?
Select the correct answer using the code given below-
a and d
a and b
b and c
b and d
Which one of the following phenomenal relationships is depicted by an Ergograph?
Temperature and absolute humidity
Rainfall and runoff
Crop production and rainfall
Crop Season and weather conditions
Given below are two statements, one labeled as Assertion (A) and the other labeled as Reason (R). Select your answer from the code given below: Assertion (A) : Dot map is especially useful when the values are distributed unevenly and sporadically.
Reason (R): Smaller the statistical unit, more accurate is the Dot map.
Codes:
A) Both (A) and (R) are true and (R) is the correct explanation of (A).
B) Both (A) and (R) are true, but (R) is not a correct explanation of (A).
C) (A) is true, but (R) is false.
D) (A) is false, but (R) is true.
A
B
C
D
Given below are two statements, one labeled as Assertion (A) and the other labeled as Reason (R). Select your answer from the code given below: Assertion (A) : The point data represents the objects on a map in a dimensionless scale but with reference to a location
Reason (R): It represents positional characteristics of features like schools hospitals, wells, tubewells, and so on..
Codes:
A) Both (A) and (R) are true and (R) is the correct explanation of (A).
B) Both (A) and (R) are true, but (R) is not a correct explanation of (A).
C) (A) is true, but (R) is false.
D) (A) is false, but (R) is true.
A
B
C
D
Given below are two statements, one labeled as Assertion (A) and the other labeled as Reason (R). Select your answer from the code given below: Assertion (A) : A map is a visual representation of an entire area or a part of an area, typically represented ona flat surface.
Reason (R): The work of a map is to illustrate specific and detailed features of a particular area, most frequently used to illustrate geography.
Codes:
A) Both (A) and (R) are true and (R) is the correct explanation of (A).
B) Both (A) and (R) are true, but (R) is not a correct explanation of (A).
C) (A) is true, but (R) is false.
D) (A) is false, but (R) is true.
A
B
C
D
Given below are two statements, one labeled as Assertion (A) and the other labeled as Reason (R). Select your answer from the code given below: Assertion (A) : There are various types of maps which have specific details.
Reason (R):Maps are the representation of various parts of Earth showing the details on a particular scale. These details are, so varied that their representation on one map results in confusion.
Codes:
A) Both (A) and (R) are true and (R) is the correct explanation of (A).
B) Both (A) and (R) are true, but (R) is not a correct explanation of (A).
C) (A) is true, but (R) is false.
D) (A) is false, but (R) is true.
A
B
C
D
Given below are two statements, one labeled as Assertion (A) and the other labeled as Reason (R). Select your answer from the code given below: Assertion (A) : In the simple conical projection with two standard parallel pole is represented by an arc of circle.
Reason (R): It is the most suitable projection for mid latitude countries with latitudinal extent relatively smaller than the longitudinal extent.
Codes:
A) Both (A) and (R) are true and (R) is the correct explanation of (A).
B) Both (A) and (R) are true, but (R) is not a correct explanation of (A).
C) (A) is true, but (R) is false.
D) (A) is false, but (R) is true.
A
B
C
D
Given below are two statements, one labeled as Assertion (A) and the other labeled as Reason (R). Select your answer from the code given below: Assertion (A) : Conical equal area projection with two standard parallel is a perspective projection.
Reason (R): In this projection tangential scale is true along the standard parallels.
Codes:
A) Both (A) and (R) are true and (R) is the correct explanation of (A).
B) Both (A) and (R) are true, but (R) is not a correct explanation of (A).
C) (A) is true, but (R) is false.
D) (A) is false, but (R) is true.
A
B
C
D
Given below are two statements, one labeled as Assertion (A) and the other labeled as Reason (R). Select your answer from the code given below: Assertion (A) : In the polar zenithal gnomonic projection equator can not be represented.
Reason (R): In the polar zenithal gnomonic projection interparallel spacing increases rapidly towards the equator.
Codes:
A) Both (A) and (R) are true and (R) is the correct explanation of (A).
B) Both (A) and (R) are true, but (R) is not a correct explanation of (A).
C) (A) is true, but (R) is false.
D) (A) is false, but (R) is true.
A
B
C
D
Given below are two statements, one labeled as Assertion (A) and the other labeled as Reason (R). Select your answer from the code given below: Assertion (A) : Simple conical projection with one standard parallel in the generic sense, is a perspective projection.
Reason (R): It is a aphylactic projection i.e., one that maintains neither area nor shape.
Codes:
A) Both (A) and (R) are true and (R) is the correct explanation of (A).
B) Both (A) and (R) are true, but (R) is not a correct explanation of (A).
C) (A) is true, but (R) is false.
D) (A) is false, but (R) is true.
A
B
C
D
Consider the following statements associated with representation of scale by representative fraction (RF):
1. In RF the units of the numerators and the denominator are taken as the same.
2. The units are never mentioned when the scale is expressed in the form of RF.
3. The denominator is always 100.
4. The numerator should always be 1
Which of these are correct?
1, 2 and 4
1 and 4
2 and 3
3 and 4
Match List I with List II and select a correThct answer using the codes given below-
List I (Features)
(a) The unit of mapping is real
(b) The linear data is expressed
(c) Make use of colours to distinguish different areas
(d) Make use of lines of equal value to show distribution
List II (Types of Maps)
1. Flow Map.
2. Isopleth.
3. Choropleth.
4. Chorochoromatic.
Codes:
(A) a-3, b-4, c-1, d-2
(B) a-3, b-1, c-4, d-2
(C) a-1, b-4, c-3, d-2
(D) a-4, b-3, c-1, d-2
A
B
C
D
Match List I with List II and select a correThct answer using the codes given below-
List I (Maps)
(a) Cadastral Map
(b) Topographical Map
(c) Wall Map
(d) Atlas Map
List II (Scales)
1. 1 cm : 50 km.
2. 1 cm : 500 m.
3. 1 cm : 100 km.
4. 1 cm : 25 m.
Codes:
(A) a-3, b-4, c-1, d-2
(B) a-3, b-1, c-4, d-2
(C) a-4, b-2, c-1, d-3
(D) a-4, b-3, c-1, d-2
A
B
C
D
Each 1: Million series (India and adjacent countries) topographical sheet contains sixteen 1: 250,000 sheets and each 1:250,000 sheet contains sixteen 1:50,000 sheets. How many 1:25,000 (7'30''Χ7'30'') sheets are contained in each 1:50,000 sheet?
2
4
8
16
For the following three types of maps, identify the correct decending order based on the scale starting from the largest map scale:
Atlas Map - Topographical Map - Cadastral Map
Cadastral Map - Atlas Map - Topographical Map
Cadastral Map - Topographical Map - Atlas Map
Topographical Map - Atlas Map - Cadastral Map
Which one of the following cartographic techniques is suitable for measureing spatial association among different attributes of the regional economy?
Dot Method
Pie Diagram
Bar Diagram
Choropleth Map
In spherical diagram, the radii of spheres are proportionate to which one of the following?
Square root of the quantities.
Cube root of the quantities.
Percentage of the quantities.
Actual quantities.
Match List I with List II and select a correct answer using the codes given below-
List I (Map Types)
(a) Choropleth
(b) Isopleth
(c) Chorochromatic
(d) Choroschematic
List II (Information Content)
1. Quantitative map showing imaginary lines joining places of equal value for any distribution.
2. Qualitative map showing areal distribution by symbols, index letters etc.
3. Qualitative map showing areal distribution by shades and tints.
4. Quantitative map showing regional variation of distribution using shades.
Codes:
(A) a-3, b-4, c-1, d-2
(B) a-3, b-1, c-4, d-2
(C) a-1, b-4, c-3, d-2
(D) a-4, b-1, c-3, d-2
A
B
C
D
For representing the data relating to cost control, quality control and assessment of progress, which of the following is/are the correct use of the diagram?
Cycle diagram
Chorochromatics maps
Chorographic maps
Both Chorochromatics and Chorographic maps
Which method is most suitable for showing proportion of area under various means of irrigation in region?
Multiple Bars
Proportionate Circles
Pie Diagram
Divided Bar
Consider the following information:
1. Area specific data in whole numbers.
2. Distribution not exactly uniform within area units.
3. Data cannot be modified to any indices.
Which technique will be most suitable for showing such data on a map?
Choropleth Map
Choroschematic map
Bar diagrams super-imposed on map
Dot Map
A flow chart can be used to show which of the following?
Magnitudes only
movement directions only
Direction and Magnitude of movement
Direction, magnitude and periodicity in movement
Consider the following statements:
1. International projection is based on the principle of cylindrical projections.
2. International sheets on this projection are produced at a scale of 1:1000,000.
Which of the statements given above is/are correct?
1 only
2 only
Both 1 and 2
Neithar 1 nor 2
If a certain subject or theme is being focused on, you'd look on a...
elevation map
political map
physical map
thematic map
Which type of map shows how many people live in a certain area?
population density map
resource map
physical map
political map
Which map uses different colours to indicate their frequency?
Chloropleth
Thematic
Street
Poltical

Which type of map shows natural resources by using symbols?
Duck Finding Map
Road map
Climate Map
Economic/ Resource Map

What type of thematic map is this
Isoline
Choropleth
Dot
Mental

A mental map is?
A person's internal perception of space
Telling a story through color
showing mostly weather patterns
Used primarily to convey information about population

What is a dot map used for?
Only used for population clusters
To tell a story about quantity
To tell a story about quality
A visual representation of space
Which map gives more information
Small scale map
Ordinary map
Large scale map
None of the above
What is cartography?
the study of the Earth's surface, its atmosphere and its features
the study and practice of making maps
the average weather in a place over many years
the study of the human past
Which one of the following maps is known as “Dynamic Map”
Dot Map
Flow map
Choropleth
Isopleth
Isolines that connect like temperature are called ...
contours
isolines
isotherms
isobars
What is the purpose of a choropleth map?
To make life easier for geographers
To visualise which countries have a higher HDI using different colours in a map
A choropleth map provides an easy way to visualize how a measurement a variable varies across a geographic area.
To make a map look more appealing
What is the correct way of using colour shading on a map?
You can use different colours and the lightest shade represents the highest values and the darkest shade the lowest value.
You can only use shades of one colour and the lightest shade represents the highest values and the darkest shade the lowest value.
You can only use shades of one colour and the darkest shade represents the highest values and the lightest shade the lowest value.
You can only use shades of different colours and the lightest shade represents the highest values and the darkest shade the lowest value.
An imaginary line which joins places having the same height above sea level:
isotherm
isohyet
contour

Complete:
The______are diagrams that represent places, instructions or ideas.
pictograms
symbols
map key
tones
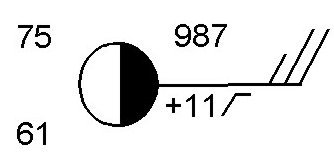

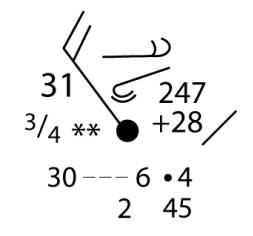


What is the present weather?
drizzle
snow
rain
fog

Which of the following isolines would you find on a weather map to indicate areas of equal rainfall?
Isobars
Isotherms
Isohyets
Contours
Isolines that connect points of equal salinity in oceanography are known as ...
isobars
isohalines
isotherms
isohyets
Which type of isoline would be used to represent areas of equal wind speed?
Isotachs
Isobars
Isotherms
Isohyets
What is the term for isolines that connect points of equal magnetic declination?
Isogons
Isobars
Isotherms
Isohyets
What is the Doppler Effect?
A change in frequency due to the relative motion of a wave source and an observer
When a wave overlaps with another wave
When a wave bounces off of another object
When a wave bends due to traveling through a different medium
What is the purpose of station models?
To show what station you are on
To let people know the temperature
So people view an image instead of reading words
To show a lot of weather data in a little space

Mercury barometers based on ________ original model.
Bernoulli's
Pascal's
Rutherford's
Torricelli’s

