wayground logo

Free Printable Worksheets

Font size

S
M
L
XL
Worksheets

Mr. Stein Wednesday January 18, 2023 Make Line Plots

Total questions: 66

Worksheet time: 3hrs 31mins
Name
Class
Date
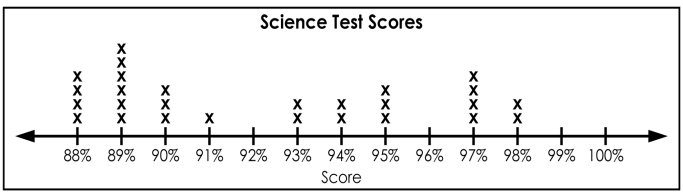
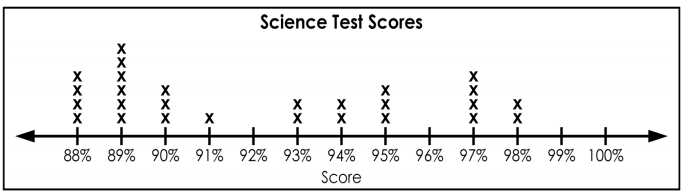
1.

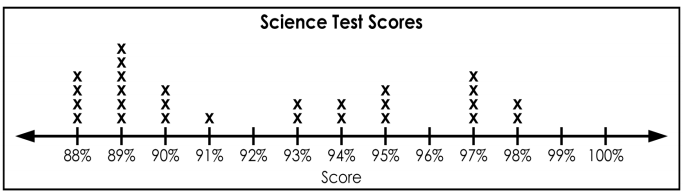
What is the highest score in the class?

a)

88%

b)

100%

c)

13

d)

98%

2.

How many students received a score of 94%?

a)

94

b)

4

c)

1

d)

2

3.

How many students received a score in the 90s?

a)

6

b)

2

c)

91%

d)

17

4.

How many students scored 93% or less?

a)

6

b)

16

c)

14

d)

13

5.

How many students received a score in the 80's?

a)

2

b)

10

c)

14

d)

27

6.

How many people had 3 pets?

a)

5

b)

7

c)

4

d)

3

7.

How many students had more than 6 candy bars?

a)

5

b)

2

c)

3

d)

1

8.

How many cars were sold on Saturday and Sunday?

a)

5

b)

3

c)

8

d)

10

9.
How many of the rings are ¼ carat or less?
a)
2
b)
4
c)
6
d)
8
10.

How many students have 0 Brothers and Sisters?

a)

6 students

b)

0 students

c)

12 students

d)

10 students

11.
What is the highest score in the class?
a)
88%
b)
100%
c)
13
d)
98%
12.
How many students received a score of 94%? 
a)
94
b)
4
c)
1
d)
2
13.
How many students received a score in the 80's?
a)
2
b)
10
c)
14
d)
27
14.
How many total students are in the science class?
a)
13
b)
6
c)
27
d)
25
15.

How many students have 12 Brothers and Sisters? 

a)

4 students

b)

7 students

c)

0 students

d)

1 student

16.

How many students have 0 Brothers and Sisters?

a)

6 students

b)

0 students

c)

12 students

d)

10 students

17.

Identify the outlier of the data.

a)

9

b)

6

c)

8

d)

2

18.

What weight did the greatest number of vegetables have?

a)

18\frac{1}{8} pound

b)

14\frac{1}{4} pound

c)

12\frac{1}{2} pound

d)

58\frac{5}{8} pound

19.

How many vegetables weighed less than 58\frac{5}{8}  pound?

a)

16

b)

14

c)

2

20.
How many days did it snow MORE than 4/8 of an inch?
a)
10
b)
7
c)
8
d)
4
21.
How many of the rings are ½ carat or more? 
a)
3
b)
4
c)
7
d)
12
22.
How many of the rings are ¼ carat or less?
a)
2
b)
4
c)
6
d)
8
23.

How many mealworms were measured altogether?

a)

8

b)

11

c)

13

d)

5

24.

What is the most popular segment of time to exercise?

a)

0 hours

b)

1 hour

c)


14\frac{1}{4} hour

d)

34\frac{3}{4} hour

25.
What is the total amount of apple juice did the friends drink?
a)
16 cups
b)
6 cups
c)
18 cups
d)
8.25 cups
26.
How many students had more than 6 candy bars?
a)
5
b)
2
c)
3
d)
1
27.
How many students received a score of 94%? 
a)
94
b)
4
c)
1
d)
2
28.

What is the largest number of televisions people had in their homes?

a)

7

b)

3

c)

2

d)

4

29.

How long did Carlos spend studying this week?

a)

7

b)

2122\frac{1}{2}

c)

34\frac{3}{4}

d)

5

30.
How many cars were sold on Saturday and Sunday?
a)
5
b)
3
c)
8
d)
10
31.
Which point is 7/8?
a)
Point C
b)
Point D
c)
Point E
d)
Point F
32.
What fraction is represented at point A?
a)
4/5
b)
3/1
c)
3/4
d)
1/3
33.
What fraction is closest to    0
a)
4/7
b)
1/10
c)
8/9
d)
11/12
34.
What fraction is represented at point S?
a)
1/4
b)
2/6
c)
1/5
d)
2/5
35.
a)

1

b)

5

c)

7

d)

8

36.
a)
1
b)
2
c)
5
d)
7
37.
a)
3
b)
6
c)
9
d)
12
38.

How many students drank exactly 1/2 cup of water?

a)
5
b)
11
c)
10
d)

4

39.

Which amount of water (in cups) was most consumed by the students?

a)

1/2

b)

1/4

c)

3/4

d)

1

40.

Which amount of water (in cups) was consumed by the same number of students? (select two answers)

a)

1/2

b)

0

c)

3/4

d)

1

41.
How many days did it snow MORE than 4/8 of an inch?
a)
10
b)
7
c)
8
d)
4
42.
1)  If you put all the pencils together end to end what would be the total length of all the pencils? 
a)
15
b)
8 5/8
c)
8 1/8
d)
7 1/8
43.
Which list of data represents the data on the line plot?
a)
0, 1/8, 1/4, 1/2, 3/4, 1
b)
1/8, 1/4, 1/2, 3/4
c)
1/8,1/8,1/8, 2/8,2/8,2/8, 4/8,4/8,4/8,4/8
d)
0, 1/8,1/8,1/8, 2/8,2/8,2/8, 4/8,4/8,4/8,4/8, 1
44.
How many students received a score in the 80's?
a)
2
b)
10
c)
14
d)
27
45.
How many students scored 93% or less?
a)
6
b)
16
c)
14
d)
13
46.
a)
3
b)
6
c)
9
d)
12
47.
What is the total number of hours represented on the line plot below?
a)
3   3/4
b)
2  3/4
c)
2  1/4
d)
1  1/2
48.

Altogether, how many people had 3 or more pets in their home?

a)

3

b)

7

c)

4

d)

11

49.

Ms. Campbell is grading her 5th Grade Math Students Line Plot quiz.

Here's the data (Grades):

65, 95, 100, 75, 65, 80, 60, 90, 95, 100, 75, 95, 95, 85, 80, 70, 100, 85, 60, 100


Which Number Line is accurate enough for the data?

a)
b)
c)
d)
50.
a)
2 2/3
b)
4 1/6
c)
1 5/6
d)
3 1/2
51.
How many cars were sold on Saturday and Sunday?
a)
5
b)
3
c)
8
d)
10
52.
How many cars were sold on Monday and Tuesday?
a)
13
b)
5
c)
11
d)
2
53.
How many kids wore walking shoes to school today?
a)
7
b)
10
c)
9
d)
6
54.
How many people had 3 pets?
a)
5
b)
7
c)
4
d)
3
55.

What is this type of graph called?

a)

a bar graph

b)

a line plot

c)

a circle graph

d)

a pictograph

56.

How many students bought 5 candy bars?

a)

3

b)

1

c)

2

d)

4

57.

What was the most siblings a student had in the class?

a)

1

b)

10

c)

5

d)

3

58.

How many students are in the class?

a)

25

b)

19

c)

10

d)

1

59.

How many students had two siblings?

a)

5

b)

4

c)

1

d)

2

60.

What is the least amount of siblings that students had in the class?

a)

1

b)

10

c)

5

d)

0

61.

What number of siblings did the most students have?

a)

1

b)

10

c)

0

d)

3

62.

How many students had 9 siblings?

a)

2

b)

1

c)

0

d)

5

63.

What kind of graph is this?

a)

Line Plot

b)

Bar Graph

c)

Pictograph

d)

Pie Chart

64.

What was the most amount of candy bars a student had?

a)

0

b)

6

c)

1

d)

8

65.

How many students are in the class?

a)

8

b)

15

c)

10

d)

7

66.

How many students had 3 candy bars?

a)

1

b)

5

c)

3

d)

2