
 Worksheets
INT. SCI. Unit 1 Practice Test
Total questions: 57
Worksheet time: 58mins
The information you collect while doing your experiment is called
conclusions
data
hypotheses
procedures
How many independent variables should you have in an experiment?
two
as many as possible
four
one
Which are part of the scientific method?
Identify the Problem
Perform an Experiment
Form a Hypothesis
Collect lots of money
Communicate the Results
What is an independent variable?
What a scientist changes in an experiment to test their hypothesis
What scientist measure to see if it responded to a change
What happens when you do an experiment
What you keep the same throughout all experimental groups
What is an dependent variable?
What a scientist changes in an experiment to test their hypothesis
What scientist measure to see if it responded to a change
What happens when you do an experiment
What you keep the same throughout all experimental groups
What is the first step in the scientific method?
Data
Conclusion
No Horse Play
Observe a problem
What does C mean in CER?
(a)
What does E mean in CER?
(a)
What does R mean in CER?
(a)
Why do you need to include reasoning in your CER?
It shows how or why the evidence supports the claim
It provides justification about why the evidence is important
It includes the scientific principle to support the claim
All of the above
Which category is NOT part of the natural sciences?
Geology
Earth Science
Physical Science
Astronomy
Lilly was trying to explain to her friend the difference between a theory and a law in science. She used the theory of plate tectonics and the law of superposition as examples. Lilli explained the difference by using non-scientific language. Which statement could Lilly use to correctly describe the difference between a theory and a law in science?
A theory describes a natural event, while a law explains it.
A theory explains a natural event, while a law predicts it.
A theory explains a natural event, while a law describes it.
A theory predicts a natural event, while a law explains it.
Which of these can change when new evidence is presented?
theory
law
Which of these can be represented mathematically and provide no explanation why a phenomenon occurs?
theory
law
A description or summary of a specific phenomena in the natural world
Theory
Law
Hypothesis
Empirical Evidence
This is a well supported explanation of nature
Theory
Law
Hypothesis
Empirical Evidence
This is all the measurements and data scientists gather in support of an explanation. This should be almost the same for anyone observes it.
Theory
Law
Hypothesis
Empirical Evidence
This is an organized procedure to study something under controlled conditions. This mostly is done in a laboratory setting.
Observation
Experiment
Hypothesis
Data
Identify the correct order of the scientific method.
Conclusion, Hypothesis, Observation, Experiment,
Retest,
Data Collection
Observation, Hypothesis, Experiment, Data Collection, Conclusion,
Retest
Hypothesis, Experiment, Observation,
Data Collection,
Retest,
Conclusion
Data Collection, Hypothesis,
Observation, Conclusion,
Retest,
Experiment
One benefit of working in a laboratory setting is
Controlled environment
You get to meet new friends
It is cheaper in terms of cost
It allows the natural setting to be incorporated into the experiment


Y axis say?

Name the type of graph.
pie chart
tally chart
pictograph
bar graph

Name the type of graph.
pie chart
tally chart
pictograph
bar graph

Name the type of graph.
pie chart
tally chart
pictograph
bar graph
Name the type of graph.
pie chart
tally chart
pictograph
bar graph

Name the type of graph.
pie chart
tally chart
pictograph
bar graph

Name the type of graph.
pie chart
tally chart
pictograph
bar graph

Name the type of graph.
pie chart
tally chart
pictograph
bar graph

Name the type of graph.
pie chart
tally chart
pictograph
bar graph

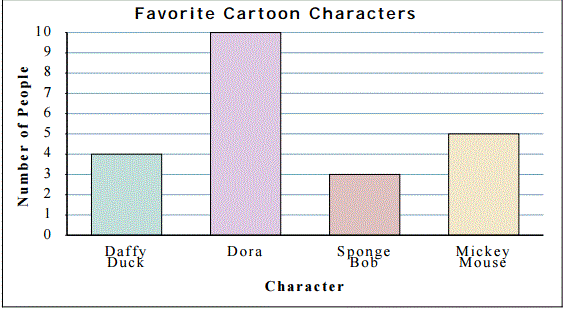


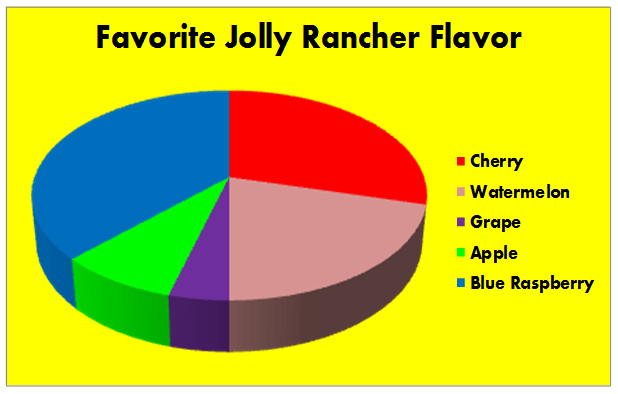


Is a histogram the same as a bar graph?
Yes, because they both use intervals.
No, because a histogram displays numerical data while a bar graph displays categorical data.
Yes, because they both use bars to display data.
No, because a histogram displays categorical data while a bar graph displays numerical data.
A prototype is
a criteria
a germ
a robot
a working model
Repetition is when one scientist
copies another scientist's experiment.
bumps into another scientists.
repeats their own experiment several times.
clones a T. rex.
What are constraints?
sharing ideas
guidelines that are needed to be successful
factors that limit what can be done
a model of a new design

