
 Worksheets
Unit 2 - Quantitative Data
Total questions: 57
Worksheet time: 2hrs 53mins


_________________________ is a set of information collected about people or things.
frequency
data
statistical question
attribute
The number of times a data value occurs is called the __________________________.
attribute
data
statistical question
frequency


What was the lowest score?
20
30
39
40
What was the median score?
39
50
55
16

The box-and-whisker plot displays the number of inches of snowfall last year for 14 cities. Each city had a different amount of snowfall.
What is the median amount of snow that fell?
80 inches
64 inches
56 inches
76 inches

Consider the boxplot below. What is the interquartile range?
A
B
C
D

What value is the lower quartile (Q1)?
66
58
60
64

When you are finding the MEDIAN and 2 numbers are in the middle, what do you do?
List both of the numbers as the Median.
Add the two numbers together and divide by 2.
Pick the one that you want.
The number of miles Jenna ran each week is shown:
28, 31, 36, 36, 42, 48, 52
What is the median number of miles Jenna ran?
24
39
36
Use the interquartile range to identify any outliers in the following data.
52, 63, 55, 56, 62, 54, 59, 60, 53, 61, 88
No outliers.
88 is an outlier.
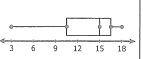
Which of the following best describes the shape of the distribution?
skewed left
skewed right
uniform
symmetrical
Should we use the mean or the median to represent the center of the data?
(a)
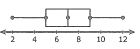
Which of the following best describes the shape of the distribution?
skewed left
skewed right
uniform
symmetrical

Which of the following best describes the shape of the distribution?
skewed left
skewed right
uniform
symmetrical

Which describes the shape of the distribution?
skewed right
skewed left
symmetric
uniform
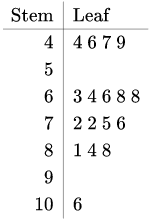
This shows how many baseball cards a group of friends have in their collections. How many friends have baseball card collections with more than 70 cards?
7
8
9
4

Which data set matches with this stem-and-leaf plot?
41,52,57,58,65,66,70,75,78,78,78,80,80,95
41,52,56,58,66,70,75,78,78,78,80,80,95,56
41,53,57,58,65,66,70,75,78,78,78,78,80,80,
52,52,57.58,65,66,70,75,78,78,78,80,80,95

This plot show how many point were scored on a video game. What is the range of the points scored?
4.8
3.9
3.8
8.4

Looking at this plot. What is the mode?
47
76
92
98
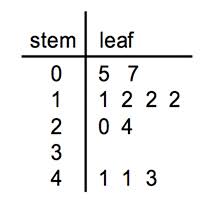
This plot show the ages of people at a birthday party. How many people at the party are 20 years of age or younger ?
7
6
8
5
What are the stems for the data set?
{14, 24, 32, 26, 10, 56}
{0, 2, 4, 6}
{1, 2, 3, 5}
{1, 2, 3, 4, 5}
{0, 1, 2, 3, 5}

To find the mean of a set of numbers, add up all the items and divide by...
To find the mean of a set of numbers, add up all the items and divide by...
4 7 5 9 8 6 7 7 8 5 6 9 8 5 8 7 4 7 3 6 8 9 7 6 9
What is the mode?
5,11,2,12,4,2
This plot show how many point was scored on a video game. What is the range (difference between the greatest and least amount) of points scored?
48
39
38
84
Data on a stem-and-leaf plot is listed in what order.
Greatest to Least
Least to Greatest
18, 19, 17, 14, 20, 20, 15, 21
What is the mode in the following numbers? [3, 24, 3, 7, 30, 1, 3, 7, 3]
3 and 7 both are modes
1 and 7 both are modes
3 only
7 only
4 7 5 9 8 6 7 7 8 5 6 9 8 5 8 7 4 7 3 6 8 9 7 6 9
What is the mode?

Determine the mode for the frequency distribution.
6
5
1
2
Use the data to identify Q1, Median and Q3. 35 40 54 65 67 69 71 73
Q1 = 47 Q2 = 66 Q3= 70
Q1=48 Q2 = 67 Q3 = 71
Q1= 47 Q2 = 67 Q3 = 70
None
Find the median, first quartile, third quartile, and interquartile range of the data.
32, 53, 72, 66, 47, 54, 49, 67, 71
Median: 54
First Quartile: 49
Third Quartile: 67
IQR: 18
Median: 54
First Quartile: 48
Third Quartile: 69
IQR: 21
Median: 54
First Quartile: 48
Third Quartile: 69
IQR: 22
Median: 54
First Quartile: 49
Third Quartile: 69
IQR: 20
The five number summary of the data is
Mean, Median, Mode, Min and Max
Mean, Standard Deviation, Min, Max and Range
Median, 1st Quartile, 3rd Quartile, Min, and Max
Mode, Mean, Standard Deviation, IQR and Outlier
The five number summary is Min 12, Q1 15, Median 16, Q3 21 and Max 26. Which of the values below would be an outlier
7
27
15
31

What does point C on the box plot represent?
First Quartile
Median
Third Quartile
Mean

What is the median of this data set?
8
12
15
19
What is the range of this data set?
6
12
13
19
Range is
the difference between the third quartile and the first quartile
the difference between the greatest and least data values.

