
NEW
Font size
 Worksheets
Graphing data
Total questions: 15
Worksheet time: 32mins
This variable in an experiment is the one being purposefully changed (or manipulated) by the scientist before the experiment is even conducted.
In an experiment to find out how the temperature affects the bounce height of a ball, the dependent variable is _____________.
In a line graph you will find the independent variable on the ___ axis and the dependent variable on the ___ axis.
(the answer must be in the correct order as the missing blanks above)
x , y
y, x
they can be switched

What is the dependent variable of the graph?


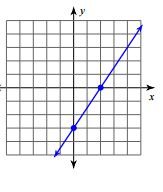


The figure below is a distance versus time graph for a falling ball.
Which variable is the dependent variable?
Time
Distance
None of above
both
The figure below is a distance versus time graph for a falling ball.
Which variable is the independent variable?
Time
Distance
None of above
both
A(n) _______ describes the relationship between two variables in which an increase in one variable results in the decreases of another variable.
inverse relationship
linear relationship
quadratic relationship
All the above

Which equation is most closely associated with an inverse relationship?
𝑦=𝑚𝑥+𝑏
𝑚 = ∆𝑦 / ∆𝑥
𝑦 = 𝑎𝑥2+𝑏𝑥+𝑐
𝑦 = 𝑎 /x
What can you determine from looking at this graph?
As resistance decreases, current decreases
As resistance increases, current decreases
As resistance increases, current stays the same
As current increases, resistance increases

The table below represents the motion of a running girl. Identify the independent variable in an experiment.
TIme
Speed

About how far does the ball fall in 1.8 s?
16 m
4m
12m
18m

