
 Worksheets
Grade 11 - Motion in a straight line
Total questions: 25
Worksheet time: 1hrs 4mins
If the position of an object is represented by : x(t)=−3t2+2t+1
then its position at t = 5 s is:
-60 m
64 m
-64 m
67 m/s
If the position of an object is represented by :
x(t)=−3t2+2t+1
then its velocity at t = 5 s is:
28 m
-28 m
-30 m
23 m/s
If the position of an object is represented by : x(t)=−3t2+2t+1
then its acceleration at t = 5 s is:
-6 m/s^2
6 m /s
-6 m
23 m/s
If the position of an object is represented by : x(t)=4t
then its initial velocity and position is:
x = 4 m and v = 0 m/s
x = 4 m/s and v = 0 m
x = 0 m and v = 4 m/s
x = 0 m/s and v = 4 m
If the aaceleration of vector is represented by : a(t)=18 m/s^2
and its initial velocity and position is 1 m/s and 5 m, then its position at t = 4 is:
18 m
153 m
73 m
0 m

The graph describes the position of a particle in one dimension as a function of time. At what time(s) is the particle’s velocity zero?
0-10 s
10-15 s
15-40 s
40-55 s

From the graph, what is the displacement of the object in the first 6 seconds?
450 m
90 m
720 m
can not be determined

For the position – time graph below, acceleration is equal to:
(a)
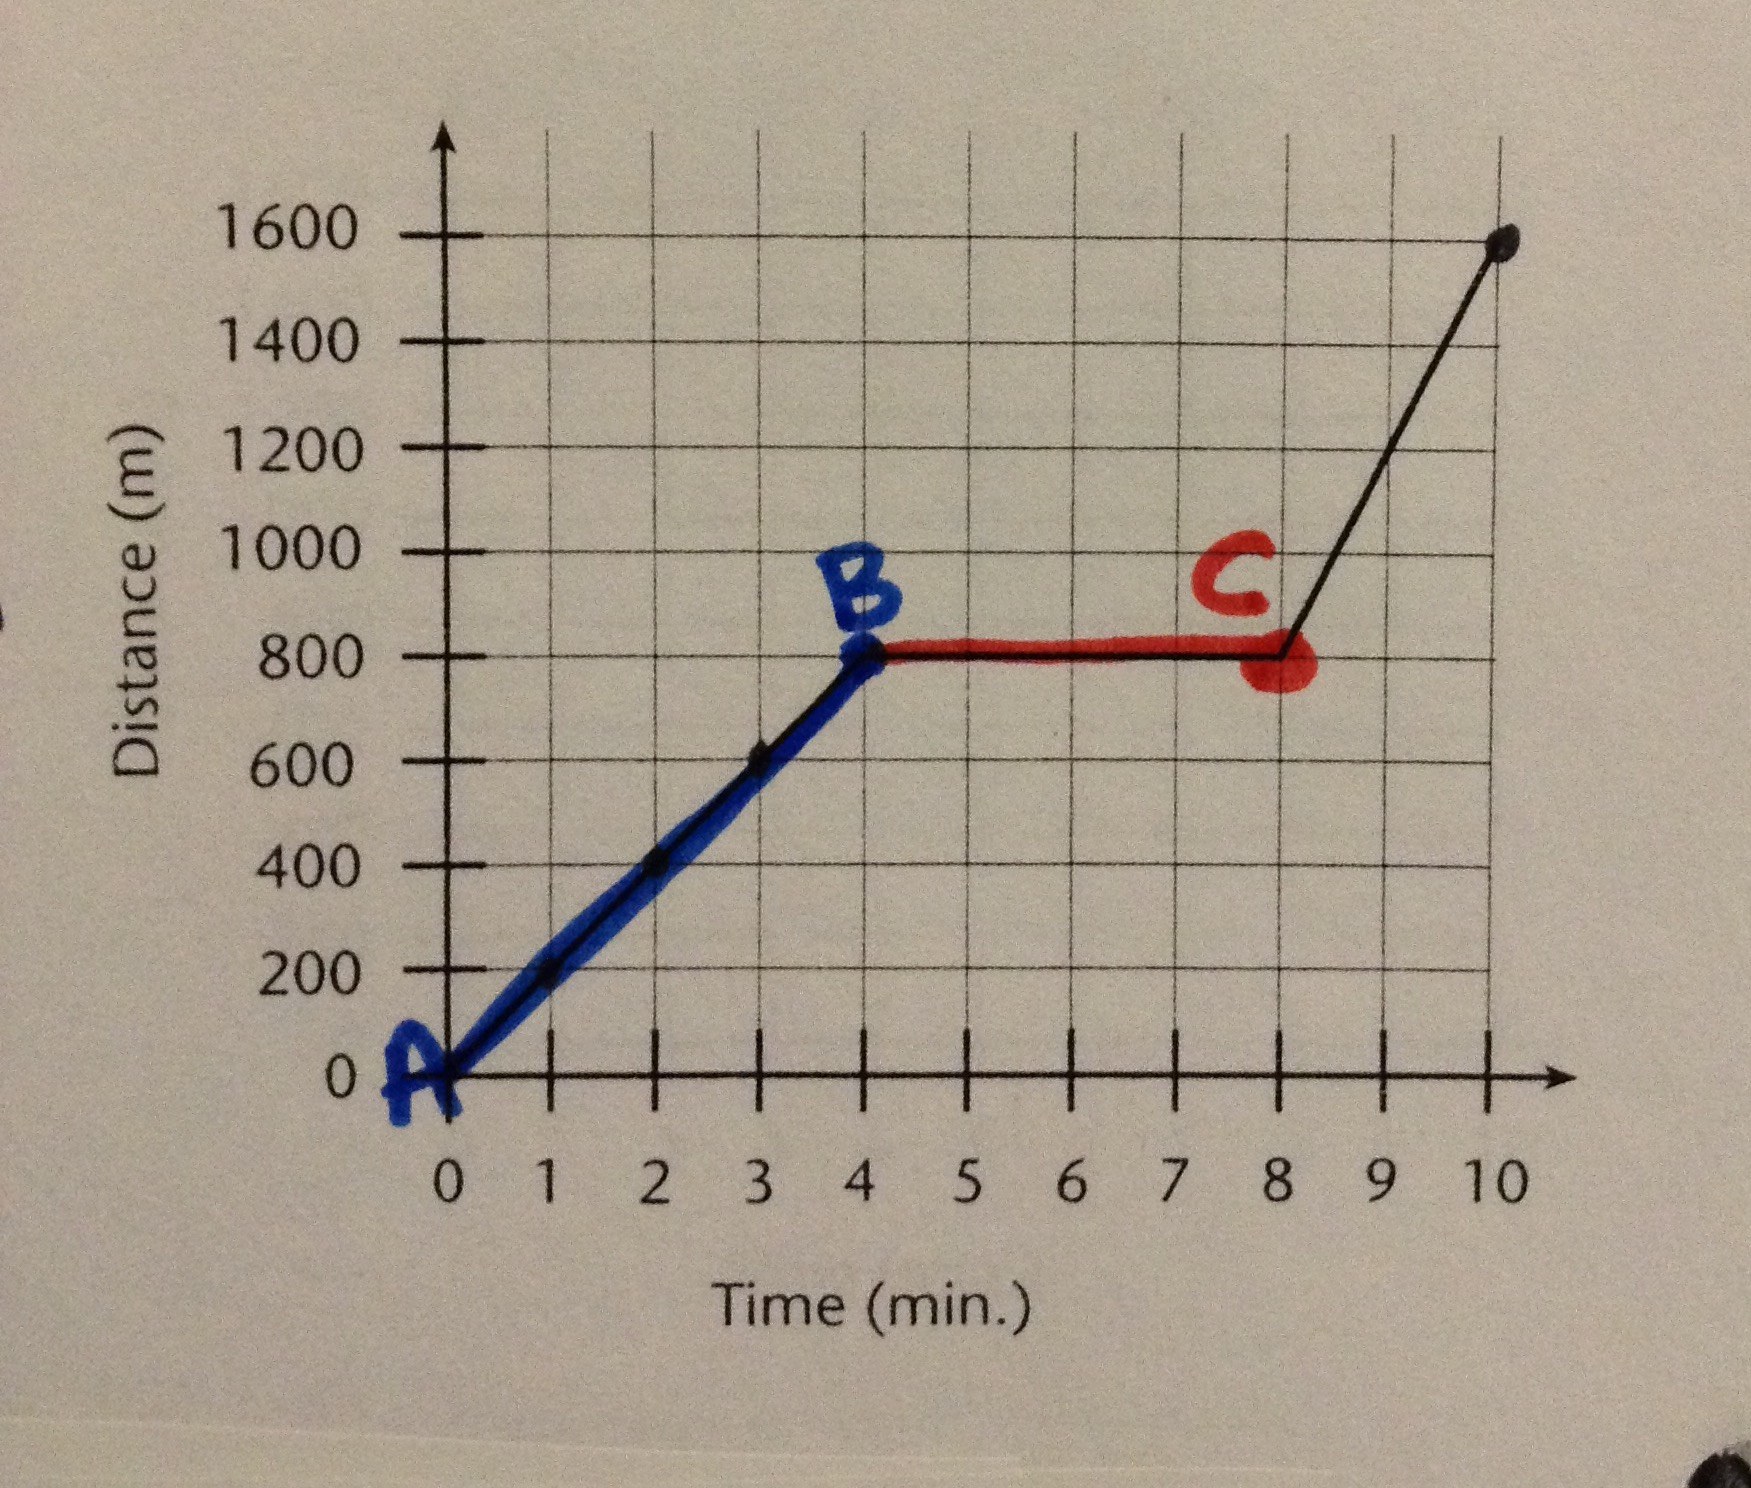
What is occurring from point A to point B?
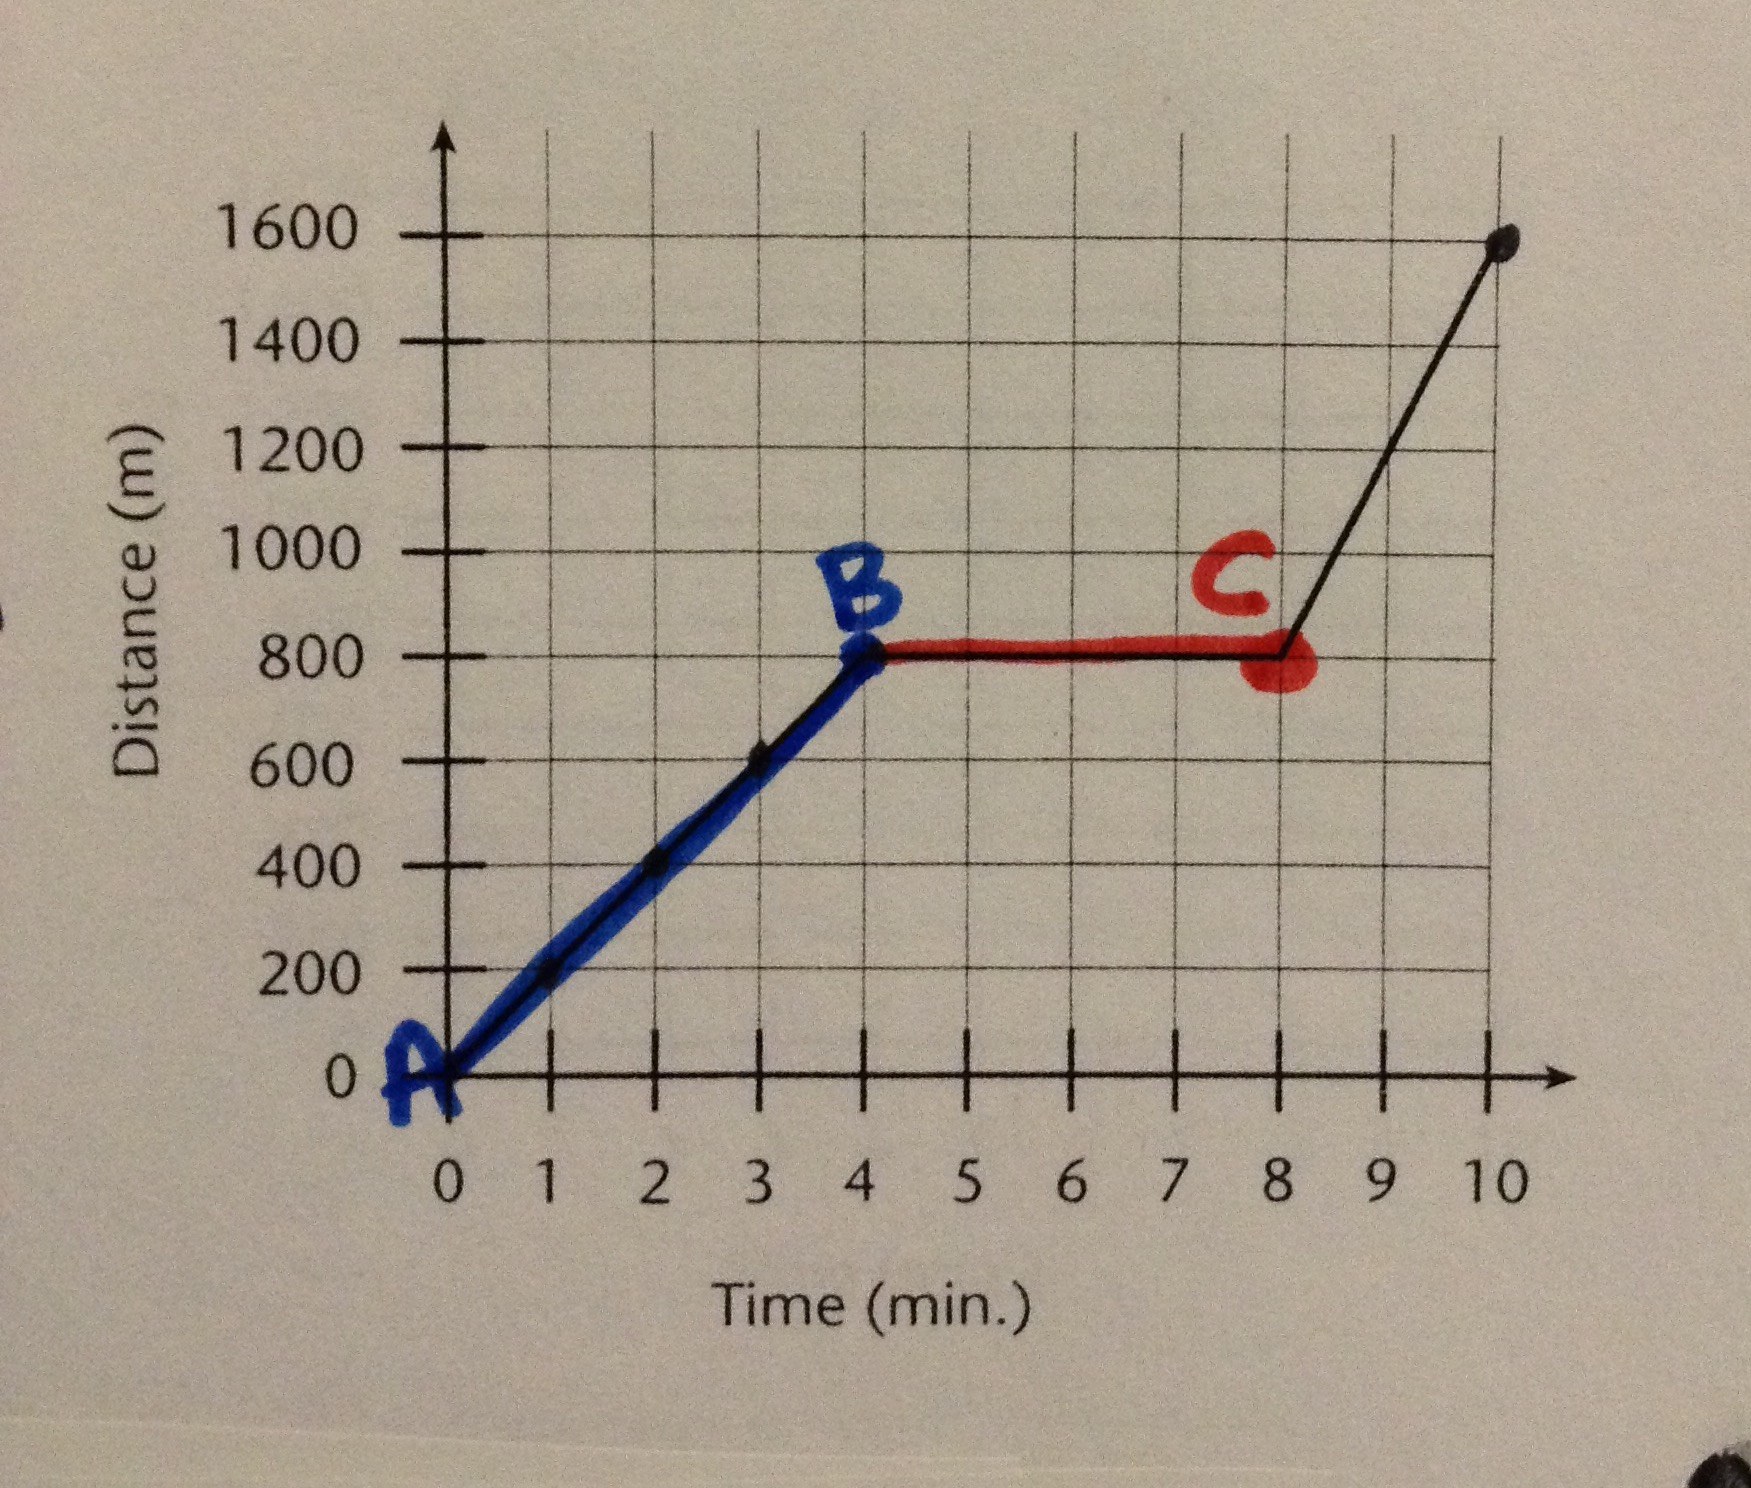
What was occurring from point B to point C?


Slope of distance time graph represents-
speed
acceleration
displacement
none of these
SI unit of acceleration is-
ms-1
ms-2
ms2
none of these

Which equation below best represents the average velocity of the walker, Raul.
v=1h4km
v=4km1h
v=2h5km
v=1h2km

The position-time graph represents two walkers. Which walker is the faster one? How do you know?
Raul, because according to the graph, he started first.
Kin, because his position-time graph looks longer.
Raul, because the slope of his position-time is steeper, meaning he goes farther in a given time period.
Kin, because the area under his graph is greater.

The position‑time graph represents part of a car trip along a straight road.What is the average velocity of the car for the first 8.0 s?
20 m/s
15 m/s
12 m/s
8 m/s

The lines represent displacement vectors for the route along which a person moves.
What is the total distance traveled?
3 m
4 m
5 m
6 m
A bus leaves the terminal and travels for 120 s at an average velocity of 10.0 m/s before it stops at its first destination. How far from the terminal is the first destination?
10 m
12 m
120 m
1200 m

The velocity-time graph of a moving particle is shown in figure , The acceleration is maximum for part:
AB
BC
CD
Equal in all parts

The velocity-time graph of a body is shown in figure, the acceleration for points AB , BC and CD are
2 m/s2 , 1 m/s2 , 2 m/s2
1 m/s2 , 2 m/s2 , 3m/s2
2 m/s2 , 0 m/s2 ,3 m/s2
0.5 m/s2 , infinity m/s2 ,0.33 m/s2
The position of a particle ( in meters ) as a function of time is given by this equation X(t) = -3.5 t2 + 4.52t + 7.91 . What is the position of the particle when it stops moving.
8.25 m
0.60 m
9.31 m
0.44 m

