
 Worksheets
Correlation and regression
Total questions: 50
Worksheet time: 52mins
Number of steps taken per day and number of kilometers walked per day. r=.92
strong positive
strong negative
weak positive
weak negative

Estimate the correlation coefficient for this scatterplot.
A) r = -0.9
B) r = 1
C) r = 0.9
D) r = -1
As x increases, y decreases.
A) no correlation
B) negative correlation
C) correlation coefficient
D) positive correlation
As x increases, y increases
A) correlation coefficient
B) causation
C) positive correlation
D) negative correlation

A line of best fit has been drawn on the scatter plot below. The relationship between these variables can be described as having
negative correlation
no correlation
positive correlation
zero correlation

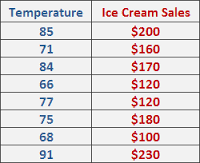
Find the equation of the line of best fit for the given data
y = 163.41x+1.49
y =- 163.41x+ 4.19
y =- 4.19x+163.41
y = 4.19x -163.41

What type of correlation best describes the scatterplot shown.
positive, weak
positive, strong
negative, weak
no correlation

What type of correlation best describes the scatter plot shown?
positive, weak
positive, strong
negative, weak
negative, strong

What correlation coefficient would be describe the correlation?
0
-0.999
0.978
0.2

Which correlation coefficient best describes the correlation shown?
0
-0.75
-0.3
0.3
Data is analyzed comparing hours studied and grades. It is determined that the correlation coefficient is 0.92. What does this mean?
There is a strong positive correlation between studying and grades.
There is a strong negative correlation between studying and grades.
There is a weak positive correlation between studying and grades.
There is a weak negative correlation between studying and grades.

Estimate the correlation coefficient for this scatterplot.
A) r = 1.2
B) r = 0.89
C)r = 0
D) r = -0.89
Estimate the correlation coefficient for this scatterplot.
A) r = -0.9
B) r = 1
C) r = 0.9
D) r = -1
Which scatter diagram shows the strongest positive correlation?


Given that the scatter diagram has a product moment correlation coefficient of 0.9, what can you conclude?
There is a weak negative linear correlation between x and y
There is a strong negative linear correlation between x and y
There is a strong positive linear correlation between x and y
There is a weak positive linear correlation between x and y
The product moment correlation coefficient between x and y is 0.98.
This means that x direct cause y (or vice versa).
True
False
For an estimate to be reliable, .......
(choose all that applies)
r is near to 1 or -1
it is an extrapolation
it is an interpolation
x must be the independent variable.

What type of association is represented by the scatter plot
Positive
Negative
None


Describe the association for the scatterplot based on data plotted.
As the weeks increase, the amount of money on the gift card increases.
As the weeks decrease, the amount of money on the gift card increases.
There is no relationship between the time in weeks and the amount of dollars.
As the weeks increase, the amount of money on the gift card decreases.
What type of correlation (association)?
The outside temperature and the amount of layers you wear.
A) Positive correlation
B) Negative correlation
D) No correlation
As x increases, y decreases.
A) no correlation
B) negative correlation
C) correlation coefficient
D) positive correlation
As x increases, y increases
A) correlation coefficient
B) causation
C) positive correlation
D) negative correlation

What is missing from this graph?
suitable title
units of x and y axis
regression line
all of these

What does this graph show?
There is no correlation between fork length and total length.
There is a positive correlation between fork length and total length.
There is a negative correlation between fork length and total length.
There is a week correlation between fork length and total length.

What is the equation of the regression line?
0.986
2527
total length (cm) = 1.1forklength (cm) + 4.1
4.1
What is the correlation coefficient of the regression line?
0.986
2527
total length (cm) = 1.1forklength (cm) + 4.1
4.1
What is the gradient of the regression line?
1.1
2527
total length (cm) = 1.1forklength (cm) + 4.1
4.1
The correlation coefficient of the regression line is 0.986. What does that mean?
There is a very strong, positive correlation between the variables.
There is a very strong, negative correlation between the variables.
There is a weak, negative correlation between the variables.
As fork length increases, so does total length.
Estimate the correlation coefficient for this scatterplot.
A) r = 1.2
B) r = 0.89
C)r = 0
D) r = -0.89

Describe the correlation in the graph shown.
A) Strong Negative
B) Strong Positive
C) Weak Negative
D) No Correlation
Estimate the correlation coefficient for this scatterplot.
A) r = -0.9
B) r = 1
C) r = 0.9
D) r = -1
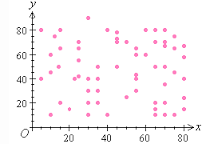
What type of correlation does this graph show?
A) Positive
B) negative
C) none
D) all of the above

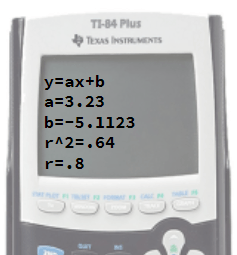
Write the equation for the linear regression shown.
y=−5.11x+3.23
r=0.8
y=0.64x+0.8

Write the equation for the linear regression shown.
y=ax+b
y=0.6x+0.1
y=0.72x+r
y=0.1x+0.6
What is a scatter plot?
A graph that shows the relationship of two data sets
A graph that shows information that is connected in some ways
A graph drawn using rectangular bars to show how large each value is
A graph that shows data changing over time
A scatter diagram may reveal
the strength of a relationship.
the direction of a relationship.
the form of a relationship.
all of the above.

When the values of two variables move in the same direction, correlation is said to be
Linear
Non-linear
Positive
Negative
The value of the coefficient of correlation r lies between:
0 and 1
-1 and 0
-1 and +1
-0.5 and +0.5
. ________measures the strength of the linear relationship between the dependent and the independent variable.
Correlation Coeeficient
Distance value
Y Intercept
Residual
The value of the ‘coefficient of determination’ (r2) ranges from -1 to +1
True
False
Coefficient of correlation of -0.90 and +0.90 have equal strength
True
False
In a simple linear regression analysis, the correlation coefficient (r) and the slope (m) __________ have the same sign.
always
never
sometimes
The ___________of the simple linear regression model is the value of y when the mean value of x is zero.
correlation coefficient
slope
y intercept
coefficient of determination
The regression equation always passes through:
(X, Y)
(a, b)
(X̅ ,ȳ)
(X̅, Y)

